

Subscribe to Our Newsletters
National Hog Farmer is the source for hog production, management and market news
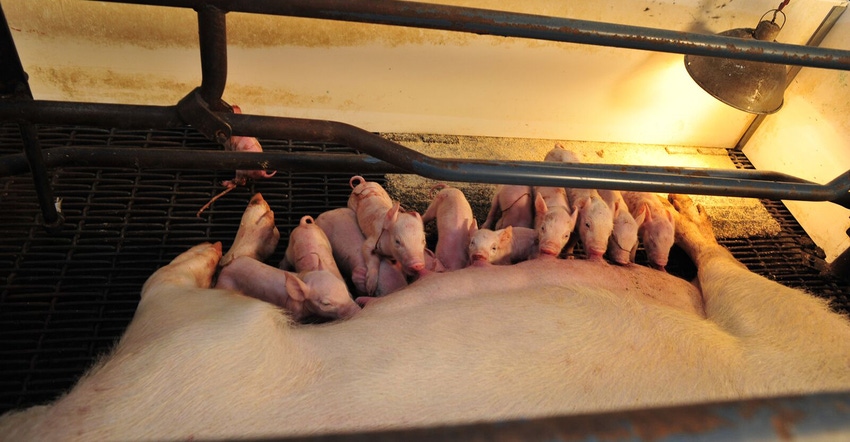
Conversion of 15% or more of the U.S. sow herd to Prop-12/Q3 compliant housing may hurt litters per breeding as farrowing rates drop due to the prohibition of crates.
October 10, 2023
Last week’s release of U.S. trade data for August indicates continued growth of U.S. pork exports versus both the previous month and previous year. See Figure 1. The 4.4% month/month increase and 2.8% year/year increase are admittedly nothing to write home about but they do still represent a growing market for U.S. pork. We still believe 2023 exports will end up somewhere around 8.5% larger than last year. That increase will put 2023 shipments as the third largest ever.

Figure 1
Mexico continues to grow as our top export market. I am concerned that Brazil will capture some of the future growth in Mexico but I certainly do not see it threatening our stature as Mexico’s number one supplier or even driving a decline of any significant size for our Mexico shipments.
Japan is still our number two market but it is relatively stable – as it has been for more than a decade. That statement is true for most other markets as well with the exception of “others.” That group, of course, is all the countries not listed in the table and our shipments to those countries continue to grow. Several of those are Caribbean, Latin American and South American countries with which we have free-trade agreements that are at some stage of being fully implemented. “Others” would rank sixth on our export list as an entity and I expect that ranking to continue to rise.
The trade data also completes the information needed to compute real per capita expenditures for pork and other meats for August. RPCE is an indicator of the status of demand at the consumer level.
Pork RPCE (Figure 2) was again lower than one year ago but August’s -7.1% is the best yr/yr figure since January. It brings the year-to-date comparison up to -9.3% compared to last year. That’s obviously nothing to cheer about but the August improvement may bode well for the rest of the year.
Per capita consumption was down only 1.5%, yr/yr, in August. That is its best performance of 2023 and is the flipside of a relatively slower export month (i.e. some amount more product was left in the U.S.). The nominal retail pork price was down 2.2% yr/yr, putting the year-to-date decline in nominal retail pork price at 2.4%. Real (ie. deflated) retail pork price was down 5.7%, yr/yr, putting the year-to-date average decline at -6.7%.

Figure 2
Beef RPCE (Figure 3) remained very close to its year-ago level in August. That’s the good news. The bad news is that beef RPCE in August of last year was well below the level of 2021 and was the first month of six double-digit year-on-year declines.

Figure 3
The new development on the demand front was the first yr/yr decline for chicken demand. Chicken RPCE (Figure 4) was 7.8% below last year in August. The caveat here is that August 2022 marked the first of six straight months of double-digit chicken RPCE growth. That surge was, I believe, driven by some substitution of lower-cost chicken for beef and pork as consumer cash availability declined following the end of stimulus payments and the exhaustion of savings accumulated during the COVID shutdowns. Note that the monthly chicken RPCE pattern looks much more like the five-year average pattern than last year’s pattern showing strong fall demand.

Figure 4
Total beef, pork and chicken RPCE was 4.2% lower than last year. The year-to-date change for three-species RPCE is -4.7% as of August. I would still characterize all three species’ demand situation as “good relative to long-term history but poor relative to 2021 and 2022.”
A major factor in the long-term economics of everything agriculture is productivity growth. American farmers and the people and companies that supply their production inputs are amazingly capable of getting more from less, driving down production costs in the long run and offering better and better value to food consumers. The pork industry has played its part in this growth!
Figure 5 shows pork production per breeding animal annually back to 1998. The growth is pretty amazing but note that the pace has slowed in recent years. This measure encompasses litters per breeding animal, pigs saved per litter, pig survival and average carcass weights.

Figure 5
Litters per breeding animal is, of course, mathematically limited by gestation period and wean-to-breed interval and is likely very near its practical high. In fact, conversion of up to 15% or so of the U.S. sow herd to Prop-12/Q3 compliant housing may hurt this number as farrowing rates drop due to the prohibition of breeding crates.
Carcass weights have increase steadily since the mid-1950s but may have plateaued. That slowing of growth is likely driven by feed costs as it was from 2005 thru 2008. The question is whether feed costs will once again decline like they did from 2013 until 2020.
Pigs saved per litter has grown steadily as well – until the past four years (see Figure 6). Porcine reproductive and respiratory syndrome and labor shortages are the most likely driver of this four-year doldrum but the last two Hogs and Pigs reports indicate that this hiatus may be over.

Figure 6
Those data points put the U.S. breeding herd right back on the trend that was in place before COVID and suggest that the industry needs far fewer breeding animals in the future. Pig survival remains a challenge to even further long-term productivity growth but much attention is being paid to this critical economic and animal well-being factor.
You May Also Like
Enter a zip code to see the weather conditions for a different location.


