Total Born for First Parity Females Drives Future Production
March 10, 2014

As we look at the farms we consult with every month, we continue to discover new trends and interactions. Several months ago we wrote about how farrowing rate for the gilts--or Parity 0 (P0) females was directly correlated to the farrowing rate for the whole farm. Farms with higher gilt farrowing rates had a higher total farrowing rate for the farm. We have seen farms with higher numbers of total pigs born for Parity 1 (P1) females also showing higher pigs weaned / mated female / year. So we decided to delve into the topic of total born in more detail for this article.
We selected 624 farms with a mated female inventory of 1,154,000 females. As you can see in Table 1, the farms were sorted by “Total Born / Mated Female / Year,” which may be a new production term for you. The data table is broken out by Top 0-10% of farms, 10-30%, 30-50%, 50-70% and 70-100%. Total born / mated female is not usually calculated on most sow records. It is calculated by taking the total number of pigs born for the year divided by average mated female inventory for the year. As you see in the table, the average of the 624 farms was 32.71 pigs, with the top farm at 40.75 pigs. The table is broken out by “Total Born / Mated Female,” “Total Born Parity 1,” “Average Total Born Parity 1 through Parity 3,” and “Total Born for Farm.” As the table shows, the Total Born Parity 1 starts at 13.76 pigs for the top 0-10% farms, with the bottom 70-100% (bottom 30%) of the farms at 12.54 pigs, versus the average of 13.05 pigs. The top farm for total born for P1 achieved 15.33 pigs.
Like what you’re reading? Subscribe to the National Hog Farmer Weekly Wrap Up newsletter and get the latest news delivered right to your inbox every week!
Table 1
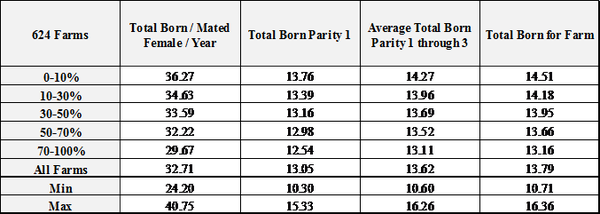
We have added Total Born Parity 1 through Parity 3 as a new number on the SMS Farm Benchmarking Report to reflect how well females are managed and perform for their first three litters. There are some farms that have a very good first litter followed by a second litter slump, and then come back with a good third litter. For farms that develop the gilts and manage the P1 female better, there are more total pigs for the first three litters. The table shows the average total born for three parities at 13.62 pigs per litter with the top 0-10% at 14.27 pigs, and bottom 30% at 13.11 pigs. The range for the 624 farms was 10.60 to 16.26 average total born / litter.
Tips for Improving First Parity Total Born
What do you need to be doing to improve total born for that first parity?
Use F1 females
Have an organized gilt development unit (GDU)
Start heat checking gilts daily after 200 days of age
Implement heat checking 7 days a week
Record heat dates for every female
Provide gestation stall exposure for 14+ days before breeding
Breed females after at least one recorded skipped heat and stall exposure
Don’t breed any gilts weighing less than 300 lb.
Aggressively feed P1 females in lactation if possible on self feeder
If possible, feed P1 females a more dense lactation diet
Provide extra feed to weaned females until they are re-bred
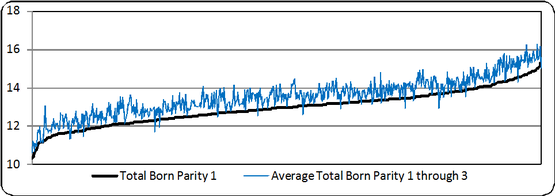
Chart 1, “Total Born Parity 1 – Average Total Born Parity 1 through 3” has the individual 624 farms on the “X” axis and total born on the “Y” axis. Total Born Parity 1 is the black line that begins at 10 pigs, and continues going up to 16 pigs. � The blue line represents Average Total Born Parity 1 though 3. The line has variation, but follows right along with the total born for P1 females. There are a few farms below the black line showing that there are some farms for which the total born for P1 is higher than the average of the first three litters.
Chart 1 Total Born Parity 1 - Average Total Born Parity 1 through 3
In Chart 2, “Total Born Parity 1 - Average Total Born for the Farm,” you can see as the same trend line as total born for P1 goes up, so does the total born average for the farm. There is more farm-to-farm variation when average total born is used. On the right side of the chart you do see several farms at 14+ pigs for P1, with total born for the farm moving up to 15 to 16+ pigs. We have always known that the gilts with higher total born for P1 females would produce more total pigs during their lifetime.
Chart 2 Total Born Parity 1 - Average Total Born for Farm
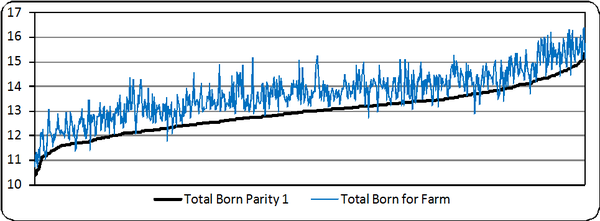
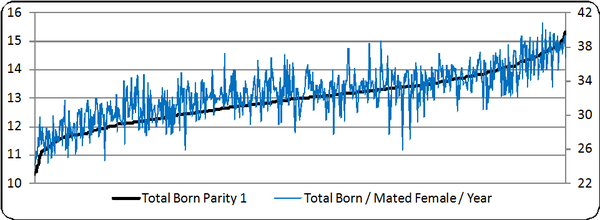
Chart 3, “Total Born Parity 1 – Total Born / Mated Female / Year” is set up with Total Born Parity 1 on the right on the “Y” axis, and this time Total Born / Mated Female / Year is on the left Y axis. In the chart you can see that if you want to improve your total born / mated female / year you have to increase the total pigs born for P1. If your target is 30 pigs weaned / mated female / year, and your piglet survival in farrowing is 85%, you need to start with 35.3 pigs total born / mated female. That means total born for P1 females needs to be at 13.8+ pigs.
Chart 3 Total Born Parity 1 - Total Born / Mated Female / Year
Where is your farm at on total born for P1 females? If you plan to improve the number of pigs your farm is weaning, it all starts with the gilts. Do you have Standard Operating Procedures (SOPs) in place for the gilt development program which includes daily boar exposure, recording of skipped heat dates, giving the gilts exposure to a stall before, breeding, and a crew trained to breed gilts after 300 lb.? What is your feeding program for P1 females in farrowing and from weaning to rebreeding?
At SMS, our mission statement is to provide “Information solutions for the swine industry.” We feel with the creation of the new SMS Farm Benchmarking Database, we now have more detailed information to share with the swine industry. If your farm would like to be part of the SMS Farm Benchmarking Database, or if you have suggestions on production areas to look at, feel free to email or call us. We enjoy being a part of the National Hog Farmer Weekly Preview team.
Previous Production Preview columns can be found at www.nationalhogfarmer.com.
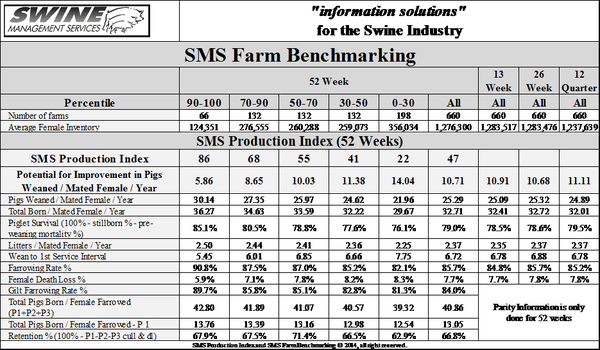
Table 2 provides the 52-week rolling averages for 11 production numbers represented in the SMS Production Index. The numbers are separated by 90-100%, the 70-90%, the 50-70%, the 30-50% and the 0-30% groups. We also included the 13-week, 26-week and 12-quarter averages. These numbers represent what we feel are the key production numbers to look at to evaluate the farm’s performance.
Table 2
You might also like:
Many Factors are Working Together to Impact Pork Supply
You May Also Like


