Subscribe to Our Newsletters
National Hog Farmer is the source for hog production, management and market news
March 17, 2014

Warning: You may finish reading today’s edition joining President Truman in his demand for “a [expletive deleted] one-armed economist.” There are a many things about which I can begin a sentence “On the other hand . . .”
First, last week’s positive porcine epidemic diarrhea virus (PEDV) accession data is a bit encouraging. But so was the previous week’s before it was revised upward! As can be seen in Figure 1, the number of new positive “cases” handled by diagnostic labs fell to 274 for the week that ended March 8. The National Animal Health Laboratory Network (NAHLN) curiously dates each week with its first day so you will see that number opposite March 2 in NAHLN’s publications. That number is significantly below the 306, 310 and 311 cases of the previous three weeks but still very, very high.
Figure 1
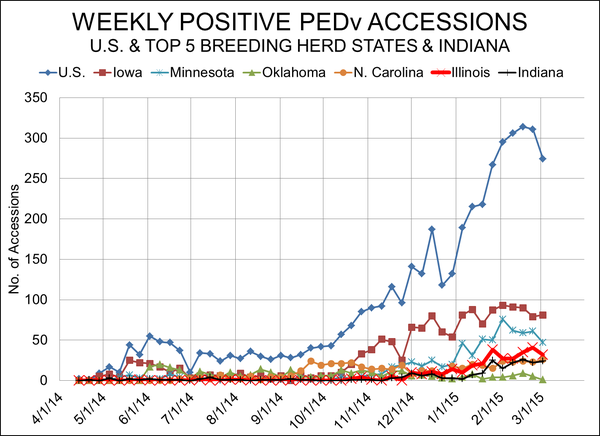
And, based on recent history, I’m betting that the 274 gets revised upward. The week ending March 1 (February 23 in the NAHLM tables) was originally reported at 256 accessions. The number now stands at 310 for that week. And the 274 still stands as the fifth largest number of any week in the outbreak thus far. Further, the numbers I used in Weekly Preview two weeks ago estimate January losses are clearly lower than the now known numbers for February.
Like what you’re reading? Subscribe to the National Hog Farmer Weekly Preview newsletter and get the latest news delivered right to your inbox every week!
And another “other hand” . . . A weekly publication from the University of Minnesota (U of M) suggests that my assumption two weeks ago that 2 million infected sows is too low; if not for January then definitely for February. The publication, “Swine Health Monitoring Project”, can be found at http://www.cvm.umn.edu/sdec/Swine Diseases/PEDV/index.htm. Part of the weekly report results from U of M researchers’ compilation of data received directly from producers regarding how many sow farms have been infected. The most recent data (the March 14 report) come from 15 systems representing 2.3 million sows. The identities of 7 of those 15 are included on the report. Other reporting companies wish to remain anonymous.
According to Successful Farming’s (SF) Pork Powerhouses 2013 and data available for Tosh Farms and Hitch Enterprises, two PEDV monitoring participants that were not among the SF top 25, it appears that the other 8 reporting entities must account for roughly 1.73 million sows. The 12 companies that are in SF’s top 17 firms and not mentioned in the report had 2.705 million sows last year. I’m not trying to identify any of these other companies but I present these numbers to show that both a high percentage of the top companies and a high percentage of the sows they represent are included in the U of M’s data. It is a large sample that appears to be very representative.
The March 14 report says that a cumulative total of about 40% (I’m reading off a graph, so I don’t have the exact figure) of the sow farms in the reporting systems had broken with PEDV as of January 31, 2014. The number of hogs “kept for breeding” on December 1 was 5.757 million. Allowing about 10% for boars, replacement gilts and gilts in development units would put sow numbers (ie. the sum of the numbers that producers might quote if I asked them “How many sows do you run?") at roughly 5.2 million. Forty percent of that number would be 2.08 million, very close to my assumption from two weeks ago. But the March 7 report says that about 48% of herds had broken by February 28. That figure would put the total at nearly 2.5 million.
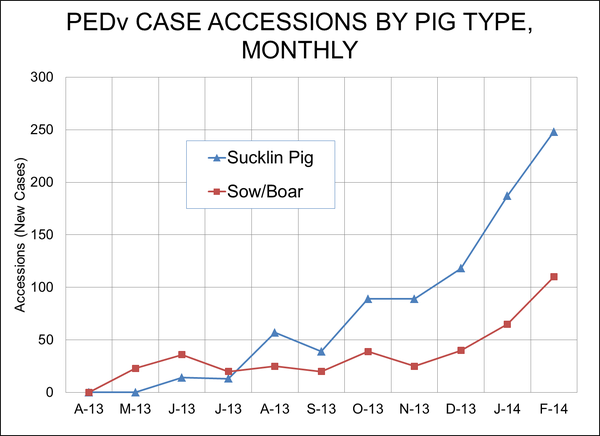
Figure 2
Finally, it appears from many discussions from producers that my total impact figure of 2.5 pigs per infected sow is too low. It looks like 2.7 pigs per sow appear to be better and may still be conservative.
Allowing for more small farms in the accession data in January and February, and for a one-month delay in part of the pig losses to account for some lingering challenges, I estimate total losses through February stand at roughly 6.08 million pigs. Using the NAHLN monthly data for suckling pig accessions (see Figure 2) to determine the time distribution of pig losses leads to a loss of 1.684 million pigs in February, just over one-third higher than in January.
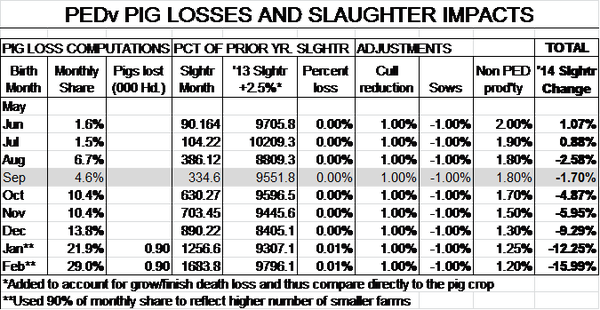
Table 2 also shows my computations and adjustments for impacts on future slaughter. Note that I made one change relative to two weeks ago in that I added 2.5% to 2013 slaughter totals to allow for normal death loss and thus estimate the number of weaned pigs that were originally destined for slaughter in that given month. It give us an apples-to-apples comparison to the pig loss figures.
The bottom line is that August slaughter will be impacted even more than July. Allowing for 4% higher weights, pork production in August could be 13% lower than one year earlier. As I pointed out two weeks ago, I’m not at all comfortable with a year-on-year change of that magnitude but the data say it is so and the feedback I have received from knowledgeable industry participants indicates that, if anything, my loss estimates are conservative. That is unbelievable.
So is there any hope for supplies? Based on discussions with people much smarter than at the recent National Pork Industry Forum in Kansas City, I believe there is.
Virtually everyone expects warmer weather to help. On the other hand, no one expects it to eliminate the virus.
Many farms have successfully returned to full- or near-full output. On the other hand, 20-30% of farms are having ongoing challenges that have reduced output to one degree or another. I have not included this “chronic” effect in my computations at all.
PRRS losses are lower due, in part, to pigs dying of PEDV that would normally have died of PRRS. In addition, many speculate that heightened biosecurity practices have mitigated PRRS. But no one knows the magnitude of the “loss offset” we should use.
Producers and their veterinarians are developing new approaches to handling breaks that are reducing initial death losses. On the other hand, some farms are finding it very difficult to return to normal output levels.
Some very sharp minds are working to develop an effective vaccine. On the other hand, vaccines for TGE (another coronavirus) have never been consistently effective and there are a bunch of snake oil salesmen preying on desperate pork producers. Please beware of the latter!
But the ultimate “on the other hand” is hog price. It is clear that the run-up in both cash and futures prices has been larger, in percentage terms, than have these losses. Producers’ revenues for the period in which the pigs are lost will obviously be lower. But the value of the rest of your pigs this year will increase more than enough to offset it. That obviously assumes you farrow pretty much continuously. There may be some batch farrowers who see lower revenue. I hope not but it is quite possible.
Table 1
You might also like:
High Hog Prices Come with Complicated Consequences and a Positive Export Picture
Large Reductions Estimated in Hog Supply Due to PEDV
Exposing Sows to PEDV to Build Herd Immunity
You May Also Like
Enter a zip code to see the weather conditions for a different location.