Subscribe to Our Newsletters
National Hog Farmer is the source for hog production, management and market news
March 3, 2014

I have been hesitant to estimate supply reductions due to PEDV due to the incomplete nature of the data that has been made available through animal disease diagnostic labs. Those shortcomings are not the labs’ faults, just the nature of a new disease that is not reportable to state or federal veterinary authorities. But the number of cases reported in recent weeks and growing comfort with some of the loss numbers compel me to estimate reductions for this summer and they are pretty amazing.
PEDV-positive case submissions continue at high levels. The decrease in case numbers we observed the week of February 9 (from 301 to 271) disappeared when last week’s data were published and the February 9 total was revised to 310. The number held constant at that high level the week of February 16.
The National Animal Health Laboratory Network (NAHLN) has published monthly data in its recent week reports that divide the accessions by pig type. Figure 1 shows these data for April through January. I am not using February data since it is incomplete but it appears February case numbers will EXCEED those of January when published. Of most usefulness, we think, is the suckling pig case accessions data since we know those cases MUST involve sow farms with baby pigs on them.
Figure 1
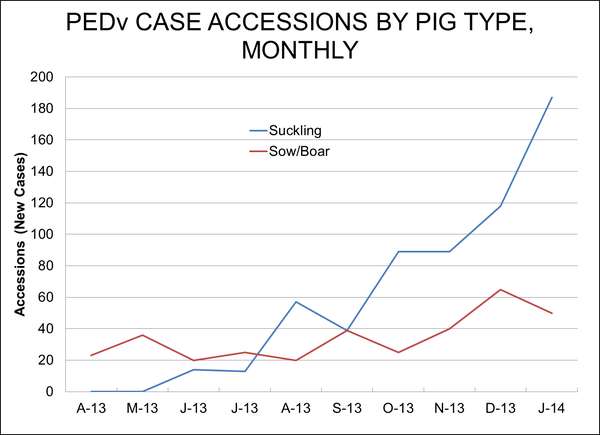
The area under the blue line in Figure 1 represents all of the positive suckling pig accessions since May. 30.9% of those occurred in January. 19.5% were in December and 14.7% were in both October and November. We believe the January numbers include a good number of small farms since we started hearing of a quite a few show pig herds breaking last month. Therefore, we will just use 90% of the 30.9% of observations in our computations since many of those cases involve fewer pigs relative to the generally larger commercial farms that dominated the cases last summer and fall.
Industry observers estimate that anywhere from 2 to 2.5 million sows have now been infected. We will use the 2 million figure to be conservative. Pig losses have been estimated to be from 2.0 to 3.5 pigs for every sow in inventory on infected farms. The 2.0 figure represents, we think, the immediate losses during the 3 weeks or so that the disease is extremely virulent. There are some losses in subsequent weeks so we are going to use 0.5 pigs per sow for cases lagged one month. The sum of 2.0 pigs per sow for the January cases and 0.5 pigs for the December cases would therefore estimate the total pig losses in January.
Like what you’re reading? Subscribe to the National Hog Farmer Weekly Wrap Up newsletter and get the latest news delivered right to your inbox every week!
Part of the losses will be offset by various practices.
Fewer cull animals – add 1% to slaughter. High prices will provide an ample incentive to make acceptable pigs out of ones that weren’t worth the trouble before.
Fewer sows – deduct 1% from slaughter. This one is a bit iffy, especially when we get to July, a month that saw sharply lower sow slaughter last year. But futures prices now have 2014 profits at over $40 per hog and that, plus a definite value for PEDV immunity, will get sows retained.
Productivity will still increase on the part of the breeding herd not yet infected -- Add 1.25% = 2.5% on half the sows
Higher market weights will not impact slaughter but will impact production. They have added about 3% to production since December but we believe that will grow to 4% this summer since so much finishing space will be available and packers will be scrambling for pounds, period.
Tally the impacts:
2 million sows x 30.9% * 90% = 556,200 January sows
2 pigs/sow x 556,200 sows = 1.1124 mil. January pigs lost from sows infected in January
2 million sows x 19.5% = 390,000 December sows
0.5 pigs/sow x 390,000 sows = 195,000 January pigs lost from sows infected in December
Total January pigs lost: 1.3074 million
Losses suggest a 14.4% year-on-year decline for July 2013 slaughter
Adjustments:
Add 4% for higher weights
Add 1% for cull reduction
Deduct 1% for lower (and lighter?) sows
Add 1.25% for non-PEDV improvement
NET LOSS IS 9.15% OF JULY ��‘13 PRODUCTION
Compute price impacts
The rice flexibility for hogs is 2 to 3. Using 2.5 would imply a price increase of 22.9%
July 2013 National Net Wtd. Avg. hog price was $101.36. A 22.9% increase would put this year’s price at $124.57.
The average CME Lean Hog Index average for June 17 thru July 15, 2013 was $103.37. A 22.9% increase would put this year’s July average index at $127.04.
With all of that said, you may still have some concerns about these numbers and I assure you that I do, too! Most notable among my concerns and some things I have heard are:
“But slaughter hasn’t fallen much yet so how do we get to those huge numbers.” Look at the graph of case accessions. Allowing productivity gains of 2% and 1.9% in June and July since relatively few sows were then infected, this approach would say December and January slaughter would be up 1% and 0.8%. Total slaughter for the two months was +2.8% and –1.7%. Barrow/gilt slaughter was +2.9% and –1.4%. Not precise but not wildly wrong to say the least.
3% higher weights will completely offset the reduction in numbers through March and will offset roughly half in April and May. An increase to +4% will leave April and May production only 1 to 3% lower than last year. But look out come June when those December losses hit the market.
Remember that estimated elasticity’s are accurate within only a limited range of data values. Our price flexibility of –2.5 implies an elasticity of demand of –0.4 and we would be comfortable using that for =/- 5% changes in supplies. But our supply changes for June and July are –7% and –9.15%. Those output levels would be far outside the range of the data from which the elasticity was estimated. No one knows, though, if the elasticity is smaller or larger outside that range and plausible arguments can be made for either one so using the relationships we have observed seems prudent.
“Prices that high are going to destroy demand.” WRONG! Own-price changes do not impact demand. They merely change the quantity demanded. High prices will “destroy” quantity demanded because there is not as much product available to be purchased — which itself causes the high prices. It is a circular argument. By our calculations, total consumption (domestic plus exports) will fall by 9.15% because total supply falls by 9.15%. The high price is merely a symptom, not the disease.
“But PRRS losses are smaller.” This one has some validity if, for no other reason, some of the pigs that normally would have died from PRRS have been, instead, killed by PEDV. Trouble is that PRRS has been so common for so long that no one knows just how large of a bite it has historically taken out of supplies. You see my math and can make your own adjustments but the changes would have to be pretty substantial to get July prices below $120.
I don’t mean to be alarming with this exercise. Nor do I intend to be in any way Pollyannaish about this summer’s prospects. But the numbers are becoming more and more clear and more and more shocking. Add in record-high beef prices and chicken output growth that has thus far been much smaller than expected and you get a protein supply situation that support this result. 2014 is going to be a wild ride indeed.
You might also like:
Many Factors are Working Together to Impact Pork Supply
You May Also Like
Enter a zip code to see the weather conditions for a different location.


