Subscribe to Our Newsletters
National Hog Farmer is the source for hog production, management and market news
February 13, 2014

We are getting more questions from producers and industry influencers on sow housing. Producers are asking what our database of close to 1.2 million sows is showing. To help answer those questions, we decided to write this article about the sow housing trends we are seeing. We decided to break the data into sows housed in gestation stalls and pens in which the sows are being fed with electronic sow feeding (ESF) systems.
To make sure we had enough sow farms using ESF, we contacted the five companies that we are aware of that are selling the technology: Osborne Industries, PigTek, Schruer, Big Dutchman and Nedap Velos, and asked them to help us develop a list of producers with ESF. We were able to add several to the list we already had. These producers were contacted to get permission to use their farm data. We asked producers several questions about the design of their specific farm.
The individual farm information that was collected showed many differences in design from farm to farm when using gestation pens with ESF systems:
● Females per pen ranged from 56 to 250
● ESF feeders per pen varied from as few as one, two or three feeders, to as many as six feeders
● ESF feeders per female ranged from one feeder for 42 females up to one feeder for 85 females
● Square footage varied from 16 to 26 sq. ft. per sow for mature females, and the range for gilts was anywhere from 13 to 26 sq. ft.
● Some 78% of the sows were kept in static groups (groups remained the same) vs. dynamic groups (females rotated in and out of the groups)
● Bred females were placed directly into the pens with no post-breeding stalls on 47% of the farms using gestation pens
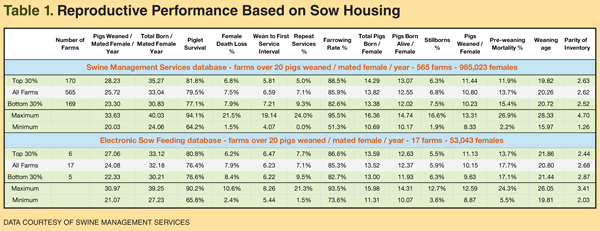
The current SMS Farm Bench-marking database has 630 farms with 1,173,700 females from the USA, Canada and China. Farms that were selected for the data set had to have been in production for two or more years, and could not be in a period of expanding or depopulating. Farms had to have been at 20+ pigs weaned/mated female/year for the last two years.
We know that some of the farms selected could have had some health challenges during the last 52 weeks that could possibly have influenced the data that were used in the data set. The data set was compiled to represent the 52-week time period ending Sept. 28, 2013.
Table 1 (page 39) shows data broken out to represent 565 farms with total gestation stalls, with 985,023 females, and farms using gestation pens with ESF at 17 farms with 53,043 females. The average farm size for the ESF group was 3,120 females, with a range from 598 to 10,268 females.
Based on two housing options, the data show:
● Stalls. Average pigs weaned/mated female/year for the 565 farms with all gestation stalls was 25.72 pigs/year, with a range of 33.63 to 20.03 pigs.
● Pens. The 17 farms with ESF feeders averaged 24.08 pigs weaned/mated female/year, with a range of 30.97 to 21.07 pigs.
In looking at production numbers:
● Stalls. Farrowing rate percentage on the farms using stalls was 85.9%, with a range of 51.3%-95.5%.
● Pens. Farms using ESF recorded a farrowing rate of 85.3%, with a range of 73.6%-93.5%.
● Stalls. Total pigs born/female was 13.82 pigs for farms using gestation stalls.
● Pens. Total pigs born/female was 13.52 pigs for ESF farms.
● Stalls. Pigs born alive/female averaged 12.02 pigs for stalls.
● Pens. Pigs born alive/female averaged 12.37 pigs for ESF farms.
● Stalls. Pigs weaned/female farrowed was recorded at 10.80 pigs for farms using stalls.
● Pens. Pigs weaned/female farrowed was at 10.15 for ESF females.
● There was very little difference in weaning age, with stalls at 20.26 days vs. ESF at 20.80 days.
● The average parity for the farms was 2.62 litters for stalls and 2.68 litters for ESF.
Some people feel the percentage of sow deaths will be higher in pens vs. stalls. However, the data show:
● Stalls. 7.5% death loss, with the top 30% at 6.8% death loss, and the best farm at 1.5% death loss.
● Pens. ESF farms showed an average of 7.9% death loss, with the top 30% at 6.2% death loss and the lowest farm at 2.4%.
When you look at performance of these sows in farrowing, you see stillborns for farms using stalls at 6.8%, with a range from a low of 1.9% to a high of 16.6%. Farms using pens and ESF recorded an average of 5.9% stillborns, with a range of 3.6% to 12.7%. We are speculating that there may be some advantage to sows getting more exercise in pens, helping to lower stillborn rates.
Preweaning mortality percentage was higher for farms using pens and ESF at 17.7% during the last 52 weeks, vs. 15.4% for farms using stalls. Is this a function of sow housing or the health status for the farm and day one pig care in farrowing? We see a trend in our database that as total born has continued to improve, both stillborns and preweaning mortality percentage have gone up.
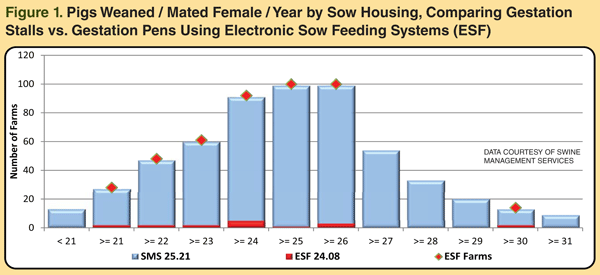
Figure 1 (on page 36) shows the large variation in pigs weaned/mated female/year in the 565 farms making up the gestation stall data set (blue), and the 17 farms using gestation pens and ESF (red). You see the 10-plus pig variation per sow in both data sets.
There are a lot of unanswered question about housing females in pens:
● What is the right number of females per pen?
● What is the ideal square footage needed per sow for optimum production?
● Do we need to house gilts and P1 females separate from older females?
● How do you manage the boss sows or sows that get injured or become health-challenged?
● What about the females that are in low body condition?
● Do we need to house sows in gestation stalls for the first 30-35 days after breeding before placing them in pen groups?
The data sets show that there is still just as much variation in performance within a facility type vs. between different facility types, such as total gestation stalls vs. sows in groups with ESF feeding systems. Both systems had sow farms at 30-plus pigs weaned/mated female/year. If you are looking at building a new sow facility, you need to look at the cost differences in building a farm with all gestation stalls or pens. Is there any additional value to the pigs finished from sows housed in open pen groups vs. gestation stalls? If you are remodeling in order to transition to gestation pen housing for sows, do you use dividers between feed drops, or do you put in ESF to control the fighting of sows during feeding times, and overall body condition scores?
No matter how your sows are housed, the key is the skill and commitment level of the people involved with the day-to-day management.
If you have caring employees who are trained and skilled at raising pigs, the type of sow housing does not matter much.
Thank you to the producers who provided data to the SMS to use in this article. In the future we will continue to look at sow housing options to provide information to the pork industry on the advantages and disadvantages. We will strive to fine-tune some of the numbers, such as the number of sows per pen, square footage per female in pen, etc. If you would like to have your farm data in the SMS Farm Benchmarking database, or have questions, contact Ron at [email protected] or Mark at [email protected], or call (402) 727-6600.
SMS provides a regular Production Preview column in the National Hog Farmer Weekly Preview electronic newsletter.
You might also like these stories:
How Long Can PEDV Survive in the Environment
Sow Housing Comparison: Consulting the Data
Will Shrinking Consumer Disposable Income Threaten Pork Demand?
You May Also Like
Enter a zip code to see the weather conditions for a different location.


