Subscribe to Our Newsletters
National Hog Farmer is the source for hog production, management and market news
As we work with farms to improve pigs weaned/mated female/year (PW/MF/Y), we continue to look at the interaction of key performance indicators. For this article, we will focus on wean-to-first service interval, which is the time it takes a weaned female to return to heat and be bred.
February 7, 2013

As we work with farms to improve pigs weaned/mated female/year (PW/MF/Y), we continue to look at the interaction of key performance indicators. For this article, we will focus on wean-to-first service interval, which is the time it takes a weaned female to return to heat and be bred. Our goal is to see if there is an interaction with farrowing rate and total born.
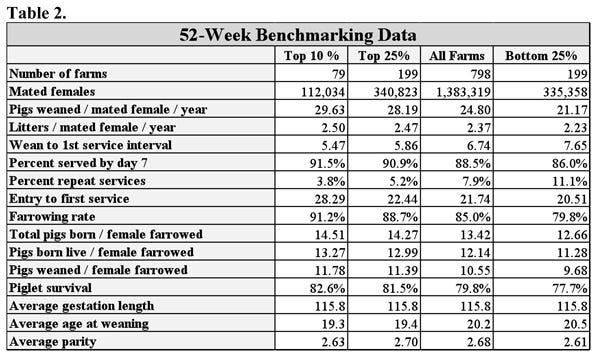
In Table 1, the Swine Management Services (SMS) 52-week performance report includes 798 farms with 1,437,000 females. Eighteen farms in the Top 10% have 30+ PW/MF/Y. We also established a subset of 391 farms with 828,000 females that we labeled SMS-NHF. These farms had a minimum of 22 WP/MF/Y during the most current 52-week period. We focused on this subset to try and eliminate farms that had major disease issues that would affect the analysis during that period. The farms are sorted by PW/MF/YR, wean-to-first-service interval, farrowing rate and total born/female farrowed.
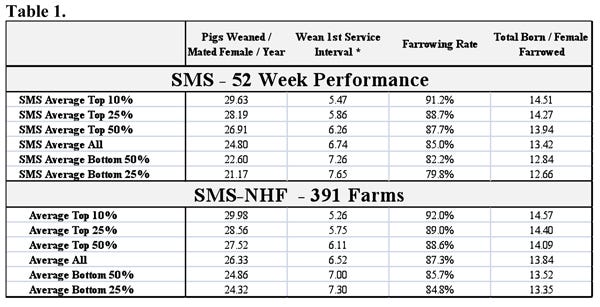
The Top 10% of farms in the full dataset averaged 29.63 PW/MF/Y, wean-to-first service interval of 5.47 days, farrowing rate at 91.2% and total pigs born/female farrowed at 14.51 pigs. The overall averages in the SMS dataset averaged 24.80 PW/MF/Y, 6.74 days wean-to-first service interval, 85% farrowing rate and 13.42 total pigs born/female farrowed. By comparison, the Bottom 25% of farms averaged 21.17 PW/MF/Y, wean-to-first-service interval of 7.65 days, 79.8% farrowing rate and 12.66 total pigs born/female farrowed.
The same trends are seen in the SMS-NHF subset with all farms averaging 26.33 PW/MF/Y, an average of 6.52 days wean-to-first service interval, 87.3% farrowing rate, and 13.84 total pigs born/female farrowed.
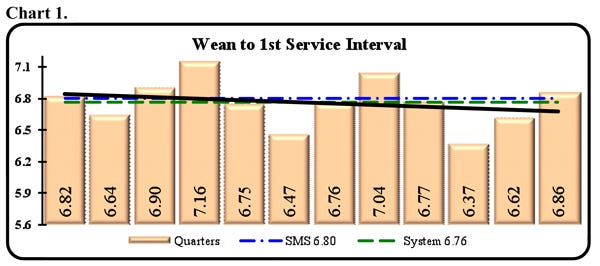
The trend line for wean-to-first service interval in the SMS-NHF subset (Chart 1) is flat for the last 12 quarters, averaging 6.78 days, with some seasonal increase in late summer.
The farrowing rate trend line (Chart 2) is linear, showing some improvement the last 12 quarters with an average of 85.7% and improvement (81.4% vs. 86.8%), with the last seven quarters at more than 86%.
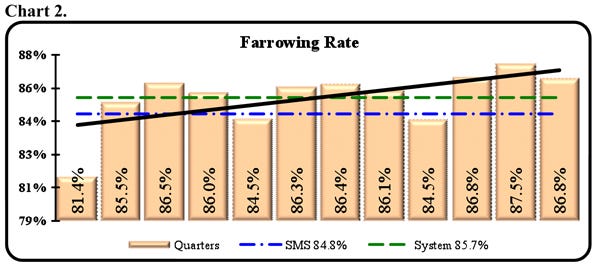
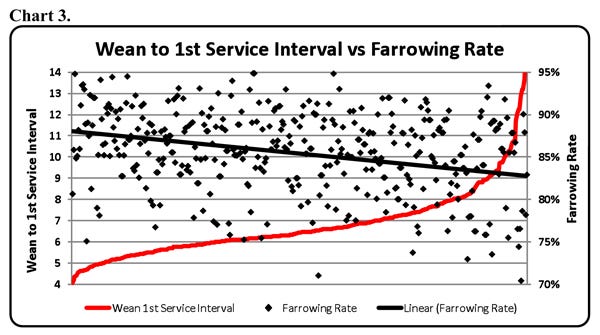
Chart 3 illustrates the wide variation among farms for farrowing rate. Sorted by wean-to-first service interval (red line), the farrowing rate of the 391 farms is linear. Wean-to-first service interval averages from as low as four days and as high as 14 days or more. With farrowing rates from 70 to 95%, the trend line declines as wean-to-first service interval increases.
We also looked at the effect of wean-to-first service interval on total born/female farrowed. Overall, total pigs born/female farrowed averaged 13.44 (Chart 4), but improved from 13.10 to 13.67 during the 12 quarters, an improvement of 0.57 pigs.
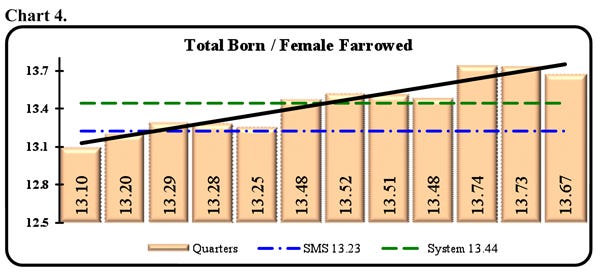
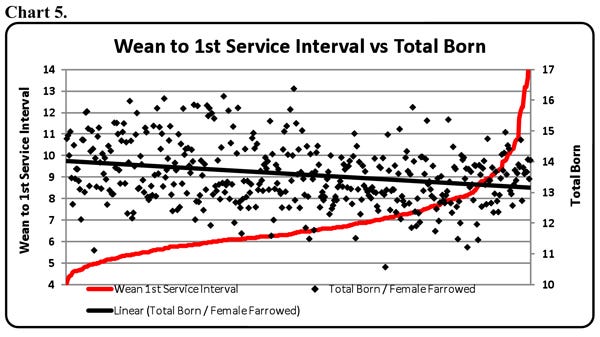
Chart 5 shows the wide variation in total pigs born/female farrowed, ranging from 10.8 to 16.4 pigs. The trend line for total pigs born/female farrowed decreases as wean-to-first service interval increases.
Following are some timely tips for reducing wean-to-first service interval:
Feed sows more aggressively in farrowing, starting at Day 1of farrowing.
Feed sows as individuals with feed hopper, multiple times per day or automated, ad-libitum feeding.
Give weaned sows extra feed from weaning until mating (flush sows to improve uterine survival and total born).
Expose weaned sows to mature boars daily, starting with the day of weaning to stimulate hormone production.
Start heat checking on Day 1 after weaning to pick up early cycling females – usually nurse sows or sows that were split-weaned.
In summary, if you want to continue improving farrowing rate and total pigs born, you may need to make some changes to get lactating sows to eat more feed. These efforts will help maintain sow body condition, wean larger pigs and ensure they will breed back sooner. When sows are fed more in lactation, they often need less feed in gestation, making it easier to manage sow body condition.
Past “Production Preview” columns can be found at www.nationalhogfarmer.com. Click on “newsletters,” then the respective date of the Weekly Preview issue you are interested in.
Key Performance Indicators
Tables 2 and 3 provide 52-week and 13-week rolling averages for key performance indicators (KPI) of breeding herd performance. These tables reflect the most current quarterly data available and are presented with each column. The KPI’s can be used as general guidelines to measure the productivity of your herd compared to the top 10% and top 25% of farms, the average performance for all farms and the bottom 25% of farms in the SMS database.

If you have questions or comments about these columns, or if you have a specific performance measurement that you would like to see benchmarked in our database, please address them to: [email protected] or [email protected].
You May Also Like
Enter a zip code to see the weather conditions for a different location.


