Subscribe to Our Newsletters
National Hog Farmer is the source for hog production, management and market news
January 4, 2016

To kick off 2016, it’s important to look at pigs weaned per female farrowed to see how much variation there is in the data and how the top farms and bottom farms are performing.
Farms selected for this column had to be mature farms weaning some P7+ females, so that takes out new start-up farms and re-pop or de-pop farms. That gave us 595 farms with a mated female inventory of 1.058 million and 2.484 million farrowings in the last 52 weeks. Farm size ranged from 216 to 10,870 mated females with the average at 1,780 females. Production numbers at the farms had pigs weaned per mated female per year average at 25.62 pigs with a range of 13.67 to 34.20 pigs. There were four farms under 18 weaned pigs per mated female per year and 11 farms at 18 to 20. Thirty-nine farms had more than 30 pigs weaned per mated female per year.
What do the 595 farms tell us? Table 1 — Pigs Weaned/Female Farrowed — breaks the 2.484 million farrowings out by parity P1 to P7+ females. The line of percent females weaned shows a normal distribution of the litters with 20.2% being P1, 17.5% P2, 15.4% P3, 13.4% P4, 11.4% P5, 9.3% P6 and 12.9% being P7+. We were a little bit surprised at the higher percent of P7+ females with 80,213 females in the data. The last 52 weeks the entire Swine Management Services farm benchmarking shows an increase in gilt replacement rate up to 60.9% with average the parity at 2.42. Table 1 shows average pigs weaned per female farrowed at 10.95 pigs with P1 at 11.19, P2 up to 11.30, P3 lower at 11.16 going down to P7+ females weaning only 10.29 pigs per litter.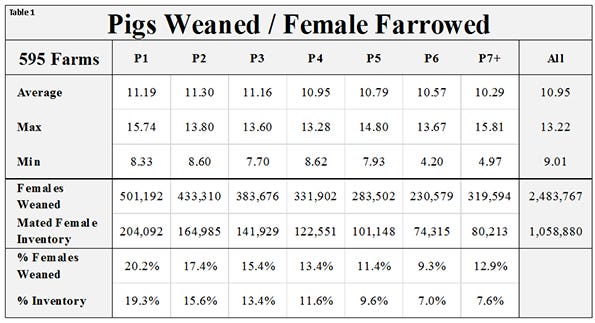
Table 2 — Pigs Weaned/Female Farrowed by Number of Farms — is broken out by parity P1 to P7+ and by pigs weaned per females farrowed. They are broke out in categories for pigs weaned per female farrowed by <9; >=9 and <10; >=10 and <11; >=11 and <12; >=12 and <13; and >=13 pigs. The table shows there were three farms that averaged >=13 pigs for the last 52 weeks. There were no farms that averaged <9 pigs, but there were some parity on some farms weaning < 9 pigs especially for the older parity females.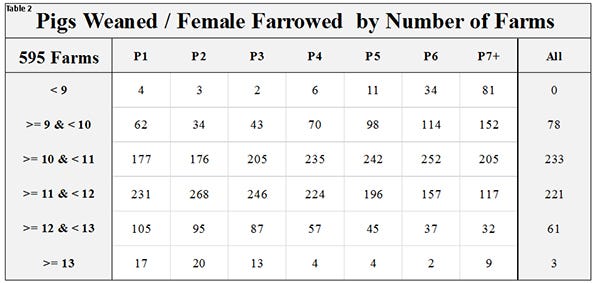
Chart 1 — Number of Farms by Pigs Weaned/Female Farrowed by Parity — is broken out by parity P1 to P7+ in a stack graph showing the number of farms that are weaning < 9; >= 9 and < 10; >= 10 and < 11; >= 11 and < 12; >= 12 and < 13; >=13 pigs. As you see in Chart 1, there are several farms weaning >= 13 pigs in the P1, P2 and P3 females with a few farms with some P7+ females. Starting with P4 there are an increasing number of farms weaning < 9 pigs per litter in the older parity females.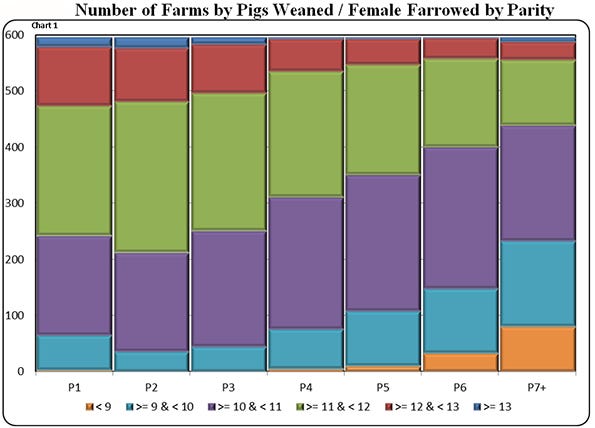
To look at the variation in pigs weaned per female farrowed in the data you need to look at Charts 2-5 — Pigs Weaned/Female Farrowed — by selected parities. Chart 2 is the overall average of the 595 farms of 10.95 pigs broken out by the lowest weaned number of 9.0 pigs to the top farm weaning 13.22 pigs.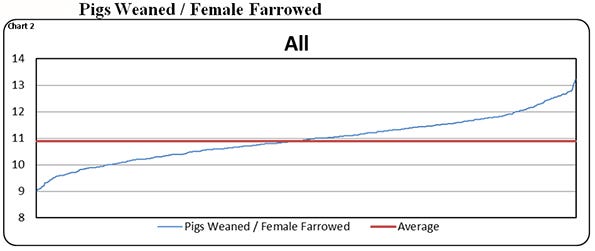
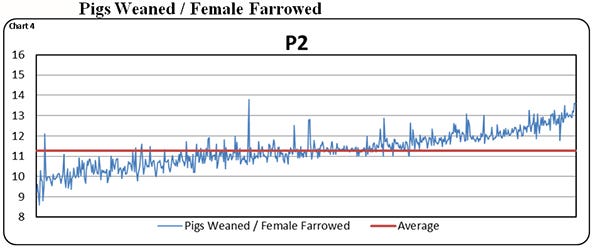
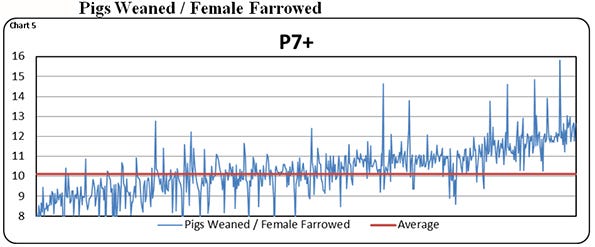
Chart 3 is P1 females with a range of 8.33 to 13+ pigs with an average of 11.19 pigs. Chart 4 is P2 with the highest average weaned at 11.30 pigs with a range of 8.60 to 13.80 pigs. Chart 5, P7+ females, shows that even with the average weaned per female farrowed at only 10.29 pigs there are farms weaning 11-plus pigs per litter. This shows if you are keeping the best of the best older females, they are still very productive in a lot of farms.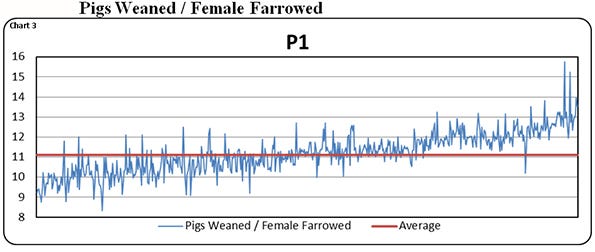
You need to look at what each parity is weaning at your farm and see how your numbers stack up. If you want to improve your numbers, it all starts with a well-planned gilt development program, making sure all gilts are getting boar exposure daily, at least one recorded heat is skipped, gilts get exposure to gestation care before breeding and weigh at least 300 pounds at breeding. In the farrowing room make sure P1 females get to nurse a large number of pigs that first litter and are given all the feed they can eat in lactation. At weaning they will need extra feed from weaning to breeding, and then left in a gestation stall for at least 30 days or if going to pen gestation placed in groups as soon as she is out of heat.
To be able to keep the best of the best you need to be culling females that did not wean the week’s average of the group she was in. This means you may be culling some very young females that are not going to be able to compete. This will allow for the best milking and productive females to remain in the farm for several litters.
If your farm is going to get to be a top farm at 30-plus pigs, each female needs to be given the best chance she can have starting as gilts.
Table 3 provides the 52-week rolling averages for 11 production numbers represented in the SMS Production Index. The numbers are separated by 90-100%, the 70-90%, the 50-70%, the 30-50% and the 0-30% groups. We also included the 13-week, 26-week and 12-quarter averages. These numbers represent what we feel are the key production numbers to look at to evaluate the farm’s performance.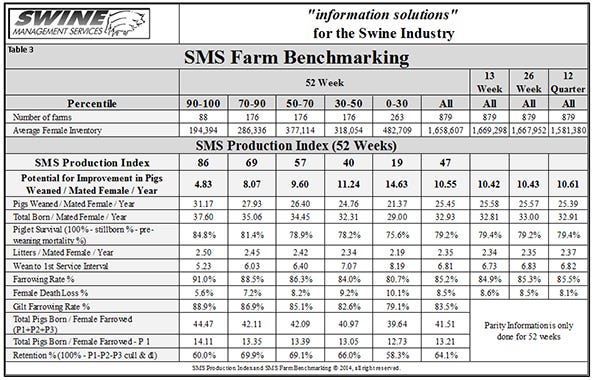
At SMS, our mission statement is to provide “Information solutions for the swine industry.” We feel with the creation of different SMS Benchmarking databases for all production areas we now have more detailed information to share with the swine industry. If your farm would like to be part of the SMS Benchmarking databases, or if you have suggestions on production areas to write columns about, please e-mail [email protected] or [email protected]. We enjoy being a part of the National Hog Farmer Weekly Preview team.
Previous Production Preview columns can be found at www.nationalhogfarmer.com.
You May Also Like
Enter a zip code to see the weather conditions for a different location.