Subscribe to Our Newsletters
National Hog Farmer is the source for hog production, management and market news
May 7, 2012

In this fourth in a series of articles on the impact of artificial insemination (AI) technicians on farrowing rate and total pigs born, we have separated out information on the effect of female returns to estrus on total born and number of pigs born alive.
Previous articles were published in Weekly Preview columns on March 5, March 12 and April 9 (go to www.nationalhogfarmer.com and click on “newsletters” to review past columns).
The data used for these articles reflects the combined performance on 11 U.S. and Canadian farms. To be included, a breeding technician had to average over 10 matings/week. Thirty-four technicians met the criteria. From the 80,013 matings, they had an average farrowing rate of 86% and a total born average of 13.46 pigs/female farrowed for 52 weeks ending Dec. 31, 2011. To effectively analyze the data, we needed female identification (ID), breeding technician ID, a semen batch code or boar ID, and the time of the day the mating took place (recorded in military time, 01-24).
The six detailed reports used for the analysis includes:
· Breeding Technician Analysis Farrowing Rate Charts
· Breeding Technician Analysis Farrowing Rate Report
· Breeding Technician Analysis Total Born Charts
· Breeding Technician Analysis Total Born Report
· In-Depth Analysis
· Breeding Weekly Analysis
The first four reports look at performance of breeding technicians by the number of services, number of matings, wean-to-service interval, return interval, parity, day of the week, hour of the day bred and semen batch code or boar identification. These reports allow us to look at each breeding technician's results for sows farrowed for the last 26 weeks and the conception rates on females bred the last 17 weeks.
The reports help analyze changes in breeding procedures or how a new breeding technician is performing by looking at groups of sows that have not farrowed yet. The last two reports focus on the last 24 weeks and 26 weeks, noting how breeding groups were put together and where the fallout (return to heat) females are coming from.
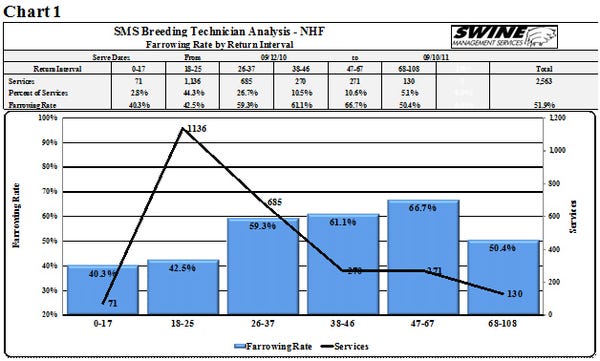
Chart 1, Farrowing Rate by Returns Interval, reveals that on 2,563 returns to estrus and rebred, farrowing rate was only 51.9%. Regular returns occurred at 18-25 days, post-breeding, and had a farrowing rate of 42.5%. There were also 270 returns bred 38-46 days, post-breeding, which were likely regular returns that were missed. Females found open on Days 26-37 were probably pregnant, but reabsorbed their pigs and returned to heat. If heat checking is done correctly, the technicians should find more than 60% of the regular returns by Day 25.
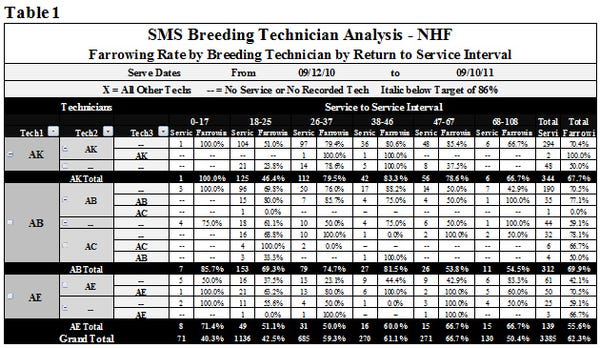
Table 1, Farrowing Rate by Breeding Technician and by Return to Estrus, shows Technician AK with a farrowing rate of returns at 67.7%, while Technician AE fell to 55.6%. When breeding returns to estrus, we feel it is important to get two quality inseminations the first day in heat. This is especially important if heat checking is only conducted once a day. Since recycling females usually have a shorter estrous period, the technician may only get one quality mating the first day and a poorer quality mating the second day.
On most farms, if a female recycles again, she is usually culled. Therefore, if you only get one mating in the service period, the question that must be asked is – did she recycle because of a poor insemination or because of a physiological problem?
Looking again at Table 1, Technician AK inseminated 294 females twice with farrowing rate at 70.4%, while 48 females were mated only once and farrowing rate dropped to 50%. Is it worth the time and bag of semen to improve farrowing rate by 20%?
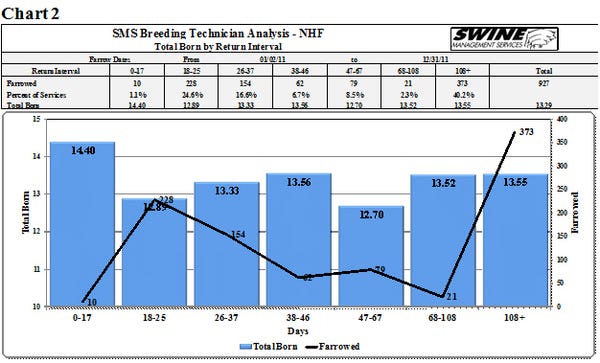
Chart 2, Total Born by Return Interval, shows there were 927 females rebred after returning to estrus and they averaged 13.29 total pigs born/litter. Regular returns rebred on Days 18-25 only averaged 12.89 total pigs born/litter. Females that returned to estrus 68 days or more after insemination had higher numbers of 13.52 and 13.55 pigs. This is probably the result of having cycled once or twice before being found in heat and rebred.
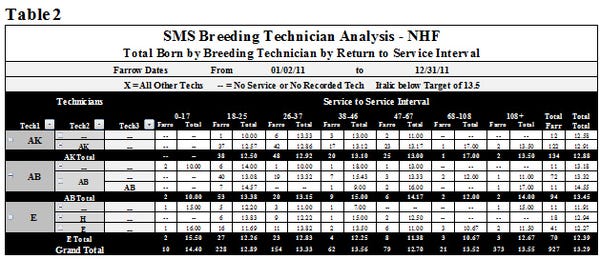
Table 2 shows there is a lot of variation in total born by technician. For example, Technician N on 249 return females averaged 13.53 total pigs born/litter, while Technician E averaged 12.39 pigs/litter on 70 females inseminated when they cycled again after a previous estrus and insemination. Number of inseminations and timing of inseminations could be factors causing females to recycle.
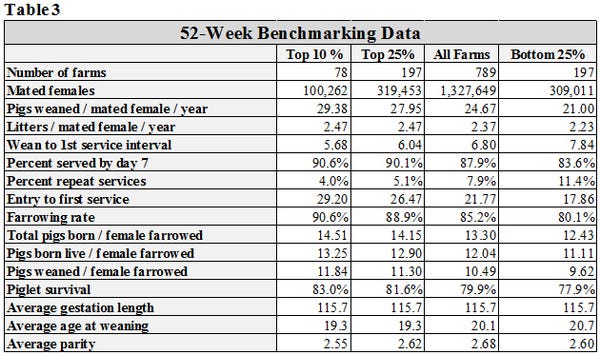
When we look at returns to estrus in Table 3, we see that 7.9% of initial services fail and females return to estrus. When we look at the Top 10% of farms, returns to estrus falls to 4%, while in the Bottom 25% of farms, returns to estrus climb to 11.4%. Unless you plan to not rebreed any returns, you need a plan to keep farrowing rate as high as possible. We do see a trend in the industry for more farms choosing to not rebreed females that recycle or they limit the number of returns rebred. Some farms have a policy of allowing one recycle, but if a female fails to conceive again, she is culled. Other farms only rebreed Parity 3 or younger females.
As farrowing rate improves, it is important for farm managers to review their return-to-estrus policy. The trend is to cull more and rebreed less. If the decision is made to rebreed, assign your best AI technician to the task and try to breed them twice the first day in heat – in the morning and again about six hours later. If the female is still in heat the next morning, inseminate her again.
At SMS, we continually look for new ways to analyze data and attempt to present it in new ways that will make it easier for the farm staff to understand. If you are interested in participating in SMS Benchmarking, contact us by e-mail at [email protected]or [email protected].
Key Performance Indicators
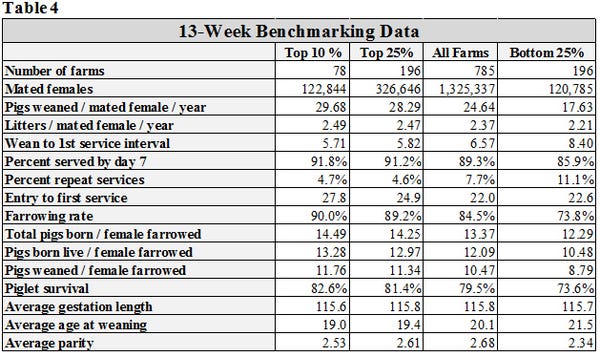
Tables 3 and 4 (below) provide 52-week and 13-week rolling averages for key performance indicators (KPI) of breeding herd performance. These tables reflect the most current quarterly data available and are presented with each column. The KPI’s can be used as general guidelines to measure the productivity of your herd compared to the top 10% and top 25% of farms, the average performance for all farms, and the bottom 25% of farms in the SMS database.
Come visit with Ron and Mark at the World Pork Expo June 6-8 at our tent in the Outside Exhibitor Area 4837.
If you have questions or comments about these columns, or if you have a specific performance measurement that you would like to see benchmarked in our database, please address them to: [email protected]or [email protected].
You May Also Like
Enter a zip code to see the weather conditions for a different location.