Subscribe to Our Newsletters
National Hog Farmer is the source for hog production, management and market news
April 9, 2012

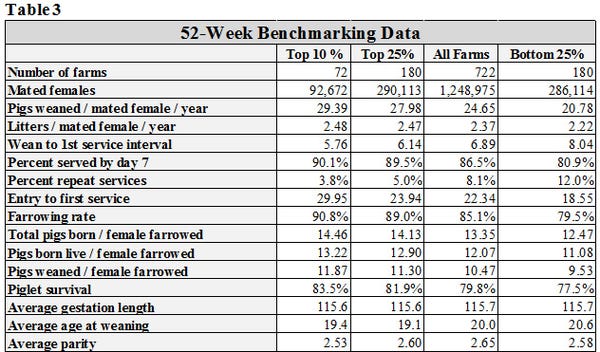
In this article, we will focus on how wean-to-1st-service interval affects farrowing rate and total pigs born by artificial insemination (AI) technician. When we look at 52- and 13-week benchmarking data (Tables 3 and 4), we see lots of variation in wean-to-1st-service interval. All farms average 6.89 days with 86.5% bred by Day 7; the top 10% have shaved the interval down to an average of 5.76 days with 90.1% served by Day 7, while the bottom 25% of database averaged 8.04 days with only 80.9% served by Day 7.
Naturally, the interval to service also affects farrowing rate. The top 10% farms have a farrowing rate at 90.8%, while the bottom 25% farrowing rate is 79.5%.
Finally, we see that the AI technician affects total pigs born. The top 10% boasts a total born average of 14.46 pigs/litter vs. the bottom 25% at 12.47 pigs/litter. All farms averaged 13.35 pigs/litter
In this third article in a series focusing on the impact of the AI technician, we zeroed in on farrowing rate and total pigs born. (Previous articles were published in Weekly Preview on March 5, "New Breeding Analysis Program Helps Identify Best Breeding Technicians," see: http://nationalhogfarmer.com/reproduction/new-breeding-analysis-program-helps-identify-best-breeding-technicians, and March 12, "How AI Technicians Affect Farrowing Rate, Total Born," see: http://nationalhogfarmer.com/health/how-ai-technicians-affect-farrowing-rate-total-born.
The data used for these articles reflects the combined performance on 11 U.S. and Canadian farms. To be included, a breeding technician needed to average over 10 matings/week. Thirty four technicians met the criteria. From the 80,013 matings, they had an average farrowing rate of 86.0% and a total born average of 13.46 pigs/female farrowed for 52 weeks ending Dec. 31, 2011. To effectively analyze the data, we needed female identification (ID), breeding technician ID, a semen batch code or boar ID, and the time of the day the mating took place, recorded in military time (01-24).
Again, we used six new detailed reports for the analysis:
· Breeding Technician Analysis Farrowing Rate Charts
· Breeding Technician Analysis Farrowing Rate Report
· Breeding Technician Analysis Total Born Charts
· Breeding Technician Analysis Total Born Report
· In-Depth Analysis
· Breeding Weekly Analysis
The first four reports look at performance of breeding technicians by the number of services, number of matings, wean-to- service interval, return interval, parity, day of the week, hour of the day bred and semen batch code or boar identification. These reports allow us to look at each breeding technician's results for sows farrowed out for the last 26 weeks and the conception rates on females bred the last 17 weeks.
The reports help analyze changes in breeding procedures or how a new breeding technician is performing by looking at groups of sows that have not farrowed yet. The last two reports focus on the last 24 weeks and 26 weeks, noting how breeding groups were put together and where the fallout (return to heat) females are coming from.
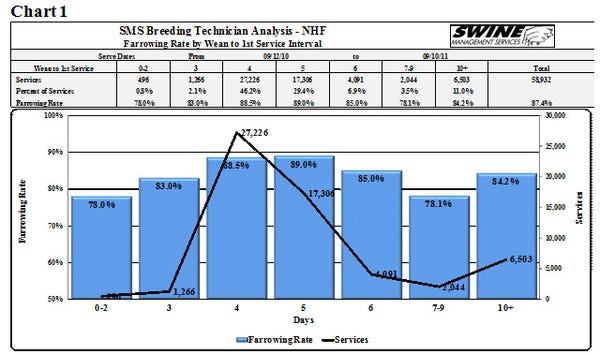
Looking at the data in Chart 1, farrowing rate by wean-to-first service interval, 58,923 weaned sows were bred back and they had an average farrowing rate of 87.4%. The 11 farms in the dataset start heat checking the day of weaning. As the chart shows, 496 services of the 48,932 (0.8%) occurred between the day of weaning and Day 2 post-weaning, with a farrowing rate of 78%; 2.1% of sows were bred Day 3 with a farrowing rate at 83%.
Clearly, if AI technicians wait to start heat checking on Day 4, they have likely missed some sows in heat and leaving them wondering why some sows are cycling on Days 18-22, post-weaning.
The trend lines in Chart 1 are typical, with highest farrowing rate for sows bred on Days 4, 5 and 6 (88.5, 89.0, 85.0%, respectively). Then we see a drop in farrowing rate for sows bred on Days 7-9 (78.1%), again typical. But if you want to improve farrowing rate, take a hard look at your breeding protocol or try to get these sows to cycle sooner.
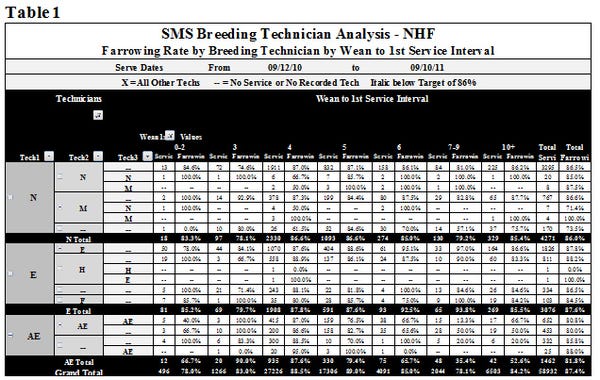
However, when we look at farrowing rate by breeding technician by wean-to-first service interval (Table 1), we have farrowing rate data on three technicians.
Farrowing rate for sows bred Day 3 is 83%. Looking closer, we see Technician “N” had 72 services with farrowing rate at 74.6%, Technician “E” had 44 services and a farrowing rate of 84.1%, and Technician “AE” had 10 services and a 100% farrowing rate.
When we look at sows first mated on Day 5, post-weaning, farrowing rate for all females first inseminated by Tech N was 86.5% (1,093 services). When Tech E provided first services, farrowing rate rose to 87.6% (591 services), while Tech AE’s farrowing rate was 79.4% (330 services).
Looking at weaned sows bred on Days 7-9, post-weaning, farrowing rate for Tech N was 79.2% on 130 services, Tech E was 93.8% on 65 services, and Tech AE was 35.4% on 48 services. Why so much variation? If you are not looking at your AI technicians’ breeding results, you will not realize how much variation exists and, thus, miss the opportunity to correct whatever is contributing to poorer results.
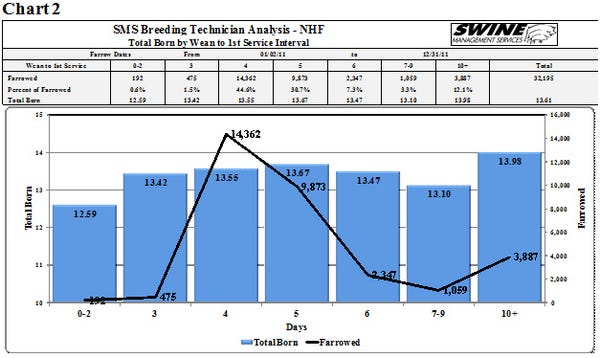
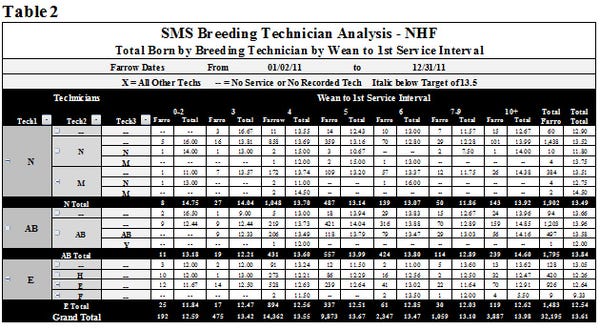
Chart 2 and Table 2 look at total born by wean-to-first service interval. Overall, total born averages 13.61 pigs/litter, but the range for sows served Day 0-2 is 12.59 pigs/litter, on Day 5 is 13.67 pigs/litter, and when served on Day 10 or after is 13.98 pigs/litter.
Table 2 shows sows bred on Day 5, by technician, Tech N averaged 13.14 pigs farrowed (487 services), Tech AB averaged 13.99 pigs/litter (557 services), and Tech E’s total born/litter dropped to 12.51 pigs/litter (337 services). The overall average was 13.67 pigs/litter. The spread from the best technician to the worst is 1.49 pigs/litter.
When all matings are tabulated, Tech AB's total born is 13.84 pigs/litter, while Tech E's is 12.54 pigs/litter – a difference of 1.30 pigs born per female farrowed. Assuming an 85% piglet survival and a $40/weaned pig value, Tech AB is worth $4,420 more dollars than Technician E for each 100 sows farrowed. In a 2,500-sow herd, the value mounts to $276,250 per year.
Of course, the AI technician is only part of the fertility triangle (Picture 1), the other factors being sow/gilt and semen source/handling. As the data shows, it is important to collect the right information to evaluate each AI technician’s performance, as well as improve and fine-tune heat detection and insemination protocols.
At SMS, we continually look for new ways to analyze data and present it in new ways to make it easier for the farm employees to understand, see the problem areas and then we show them new ideas on how to manage the higher producing females that the genetic companies are producing each year. To begin participating in the SMS Benchmarking and see how your farm compares please contact us by e-mail at [email protected]or [email protected].
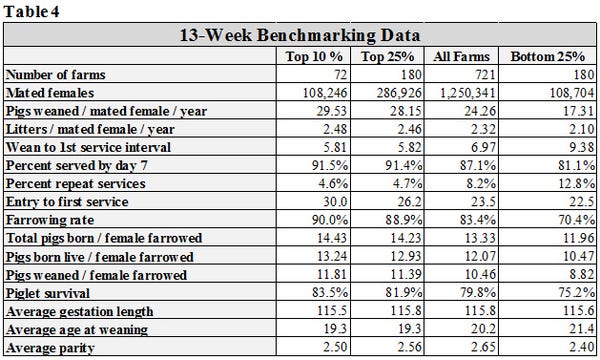
Tables 3 and 4 (below) provide 52-week and 13-week rolling averages for key performance indicators (KPI) of breeding herd performance. These tables reflect the most current quarterly data available and are presented with each column. The KPI’s can be used as general guidelines to measure the productivity of your herd compared to the top 10% and top 25% of farms, the average performance for all farms, and the bottom 25% of farms in the SMS database.
If you have questions or comments about these columns, or if you have a specific performance measurement that you would like to see benchmarked in our database, please address them to: [email protected]or [email protected].
You May Also Like
Enter a zip code to see the weather conditions for a different location.


