Subscribe to Our Newsletters
National Hog Farmer is the source for hog production, management and market news
August 5, 2015

Every month we have questions on why Swine Management Services calculations do not match the sow record programs calculations. We decided to look at four calculations: pigs weaned per mated female per year; litters per mated female per year; non-productive sow days and pigs lifetime. We picked 10 farms from the SMS Farm Analysis database.
There are many calculations for pigs weaned per mated female per year. We will look at three of the most common calculations. At SMS we have adopted the National Pork Producers Council calculations that were developed in the 1990s as part of the Production & Financial Standards for the Pork Industry. The formula is simple and is based on actual pigs weaned in the period, (pigs weaned divided by days in period multiplied by 365 days) divided by (total mated sow days divided by days in period).
Example is Farm 1, (33,418 pigs weaned divided by 364 days in period multiplied by 365 days) divided by (463,484 mated female days divided by 364 days in period) equals 26.32. The second formula used by some record programs is (pigs weaned divided by days in period multiplied by 365) divided by (average mated female inventory 140 days ago), (33,418 pigs weaned divided by 364 days multiplied by 365) divided by (1,273 average mated female inventory 140 days ago) equals 26.32. The third formula is (litters per mated female per year) multiplied by (pigs weaned per sows weaned with farrowing event), (2.44 litters per mated female per year) multiplied by (10.77 pigs weaned per sows weaned with farrowing event) equals 26.66.
Most of the farms have maintained a constant inventory over the last year and the different three formulas have similar numbers. The exceptions are farms with decreasing or increasing inventory over the past year. Examples are Farm 5 with decreasing inventory and Farm 6 with increasing inventory. That is the problem with the NPPC calculation; if the inventory increases over time it will have a lower number and if inventory decreases over time it will have a higher number. If this is going on at your farm the number may have to be adjusted for the inventory changes.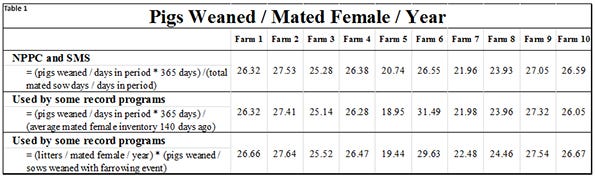
In Table 2 we will look at two of the most common litters per mated female per year calculations. The NPPC and SMS calculation is (females farrowed divided by days in period multiplied by 365 days) divided by (total mated female days divided by days in period).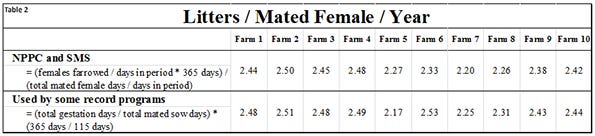
Farm 1 (2,329 females farrowed divided by 364 days in period multiplied by 365 days) divided by (347,613 mated females days divided by 364 days in period) equals 2.44. This formula uses the actual females to farrow while the other formula uses gestation days and gestation length.
Calculation 2 is (total gestation days divided by total mated sow days) multiplied by (365 days divided by 115 days). There are two variations to this formula, one uses 115 days for gestation length and the other uses 114 days for gestation length: 115-day gestation length equals 2.48 and 114-day gestation length equals 2.50.
Usually a high farrowing rate yields a high number but we found a farm where a high first service to return intervals gave a low number because it lowered the percentage of gestation days compared to mated female days. Again most of the farms have maintained a constant inventory over the last year and the different two formulas have similar numbers. The exceptions are Farm 5 that has decreased its inventory over the past year and Farm 6 that has increased its inventory over the past year with numbers at 2.17 and 2.53 litters. That is the problem with the NPPC calculation if the inventory increases over time it will have a lower number and a decreasing inventory over time will have a higher number.
Average non-productive days, as seen in Table 3, are not a good comparison between farms, because it is affected by how gilts are entered into the record program. If you enter gilts when they are selected, the non-productive days will be higher. If you enter gilts at breeding time, non-productive days will be lower.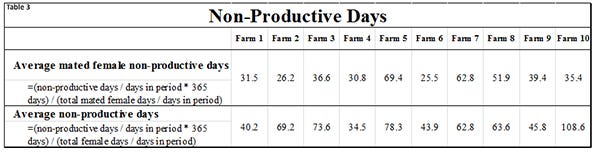
At SMS we recommend gilts be entered when they arrive or are selected to be breeding females. A different calculation we use at SMS is mated female non-productive days, the difference between the two calculations is the days from entering into the record program and first services are not included.
Farm 1 enters gilts approximately 21 days before breeding, and has 40.2 non-productive sow days and 31.5 mated female non-productive days. Farm 4 enters gilts a week before breeding and has 34.5 non-productive days and 30.8 mated female non-productive days. Farm 10 enters gilts when they are selected going into the gilt developer, 150 days before breeding, and has 108.6 non-productive days and 35.4 mated female non-productive days. Usually the manager does not have control over the time from when the gilts arrive or are selected because the time is set by isolation and acclimation standard operating procedures. The manager does have control of mated female non-productive days, this includes wean to first service days and first services to return days.
The last calculation is pig lifetime. This is a number we would like to use more, but most record programs do not calculate it anymore. The calculations, (pigs weaned lifetime from females culled, died and euthanized) divided by (females culled plus females died plus females euthanized), looks fairly simple but is hard to write into a program. In Table 4, the range is from a low of 34.0 to 61.0. There are a lot of research dollars going into looking at sow longevity. If you feel it needs to be measured and part of your record keeping program you need to be talking to your sow record keeping company about adding this calculation.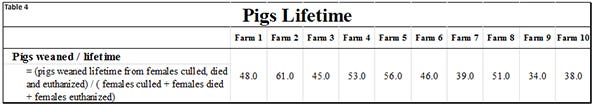
Table 5 provides the 52-week rolling averages for 11 production numbers represented in the SMS Production Index. The numbers are separated by 90-100%, the 70-90%, the 50-70%, the 30-50% and the 0-30% groups. We also included the 13-week, 26-week and 12-quarter averages. These numbers represent what we feel are the key production numbers to look at to evaluate the farm’s performance.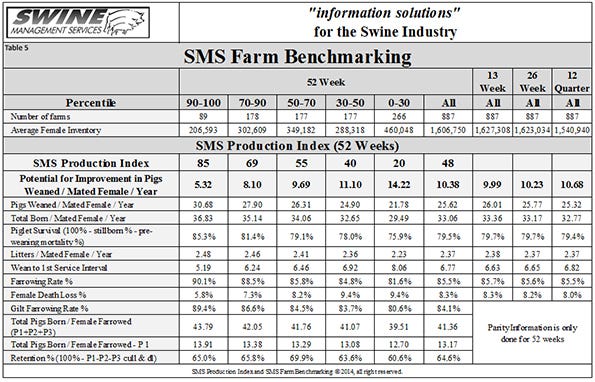 SMS is a record analysis company and we need good clean data to do our job. Let us know if you have any questions that we can help you with on using your records to the fullest.
At SMS, our mission statement is to provide “Information solutions for the swine industry.” We feel with the creation of different SMS Benchmarking databases for all production areas we now have more detailed information to share with the swine industry. If your farm would like to be part of the SMS Benchmarking databases, or if you have suggestions on production areas to write articles about, contact us at [email protected] or [email protected]. We enjoy being a part of the National Hog Farmer “Weekly Preview” team.
Previous Production Preview columns can be found at www.nationalhogfarmer.com.
You May Also Like
Enter a zip code to see the weather conditions for a different location.


