

Subscribe to Our Newsletters
National Hog Farmer is the source for hog production, management and market news
Unless you have already priced your primary feed ingredients for the remainder of this crop year, I fear that the roller coaster ride is far from over.
March 4, 2013

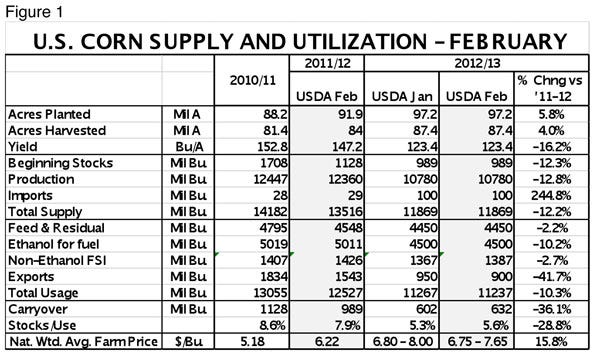
Unless you have already priced your primary feed ingredients for the remainder of this crop year, I fear that the roller coaster ride is far from over. USDA’s February update of world supply and demand conditions still indicates that corn supplies at the end of this crop year are going to be very, very tight. Figure 1 shows their U.S. corn balance sheet. The 632 million bushels projected to be in bins at the end of August represents just short of three weeks’ supply of corn.
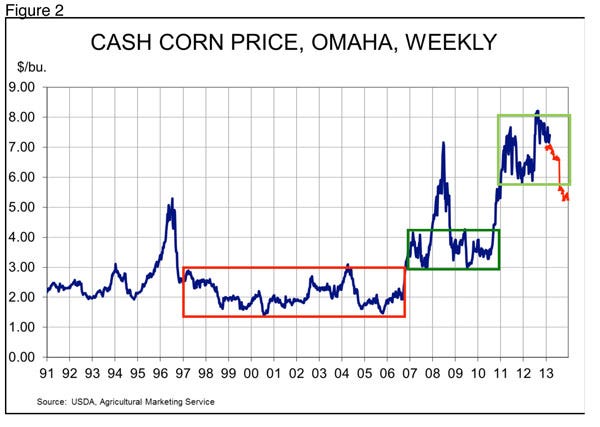
Only the 1995-96 supply was tighter. Corn price patterns for that period may be instructive (Figure 2). Omaha corn sold for $3.41/bu. the first week of January 1996. Corn prices rose to $3.81/bu. the week of March 8, but it didn’t stop there. By the first week of May, corn sold for $4.53/bu. in Omaha. But the price did not peak until the week of July 12 at $5.29/bu. The percentage increases relative that first week of January 1996 was 11.7% by March, 32.8% by May and 55.1% by July -- much higher prices even relative to a comparatively high price at the beginning of the year.
It is important to note that the run-up occurred after U.S. corn producers planted 10.8% more acres than one year earlier and while weather conditions were sufficiently good to push harvested acres up slightly relative to planted acres (up 11.4%) and to increase the 1996 yield by 12% vs. 1995. Total production in 1996 was 24.8% larger than the year before.
Could history repeat itself this year? We doubt that those magnitudes would apply, but the price in the first week of January 2013 was $7.17/bu. The beginning-of-March price is only 3% larger than that, but it would take an increase of only 11.6% from the Jan. 1 level to reach $8.00/bu. Given that corn went up nearly 25% from January to July in 1996, that doesn’t sound like a stretch at all.
In its 2013 baseline forecasts, USDA currently has planted-corn acreage falling from last year’s 97.2 million to only 96.5 million this year. Their current forecast for harvested acres is 1.4 million higher at 88.8 million acres, but these acreage figures are pretty much at odds with every private forecaster we have heard from so far. Everyone, of course, will get a better read on this year when the Prospective Planting report is published at the end of March. Should anything like USDA’s figure come to pass, I fear that it will put additional upward pressure on corn prices this year by pushing up next year’s futures.
USDA’s big offset, of course, is a projected “trend” yield of 163.6 bu./acre. We would characterize that as a “super-trend” yield since it is the result of calculations that remove all of the bad weather years and, in my opinion, assumes almost ideal growing weather.
The product of those two numbers – low acres and high yield – would provide a crop of 14.53 billion bushels, nearly 35% larger than last year’s disappointing 10.78 billion bushels. Should that kind of crop develop during June and July, we would expect some blunting of the needed run up to ration supplies, but weather will remain the key.
Two other factors are important.
First, how many acres will get planted to corn in southern states? The ratio of the price of cotton-to-corn has declined from well over 11 last summer to 8.5 last week. Still, that figure is among the highest 10% of weekly ratios prior to 2012.
The ratio of the price of soybeans-to-cotton is currently close to 17.5. That ratio was hardly ever above 15 prior to 2008 or during 2010 and 2011. It did surge over 20 in 2008-09, and again last year, but 17.5 remains a very high figure.
The point is that both crops should compete well with cotton for acres in climates that will result in early corn harvests – especially if producers use short-season varieties to try to catch high prices late in this crop year. The first USDA Crop Progress report, which contains planting progress estimates will be released on April 1.
The second key factor will be basis levels. Basis, of course, is the difference between cash and futures prices at a given location. It reflects local supply and demand conditions that may or may not be represented by the nearby futures contract. Figure 2 uses the average basis for Omaha corn from 2003-2012 to derive the predicted corn prices (red line) from futures prices as of Monday morning, March 4. But those long-term average basis figures are not likely to be the ones we see this year.
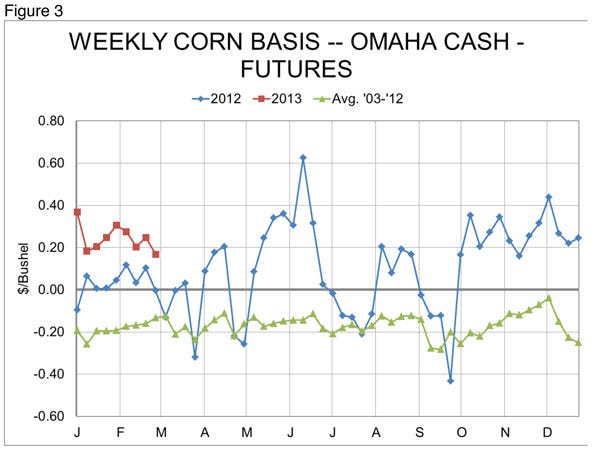
Figure 3 shows the 10-year average basis levels for Omaha as well as the weekly figures for 2012 and 2013. It is obvious that things have changed. Local corn demand, primarily from ethanol plants, has driven basis levels positive in many, many areas. In fact, Omaha basis was at or below the 10-year average during only four weeks last year. It has hardly dipped below 20 cents/bu. this year and we expect it to get larger this summer as users try to procure sufficient supplies to get to the end of the crop year.
While the potential for a large early-season crop is good, I am still afraid the basis situation could push corn prices extremely high – over $8.00/bu. – this summer. And that will be your cost: a) if you can find it and b) before you start hauling it. The first issue will not be a problem if you are willing to swallow the costs of the second issue provided you don’t get short on time. I have said for several years that the time was coming when summertime corn availability would be an issue in some areas. I think the time is here.
The bottom line is this – get your summer grain supply needs “in hand” – not just price-covered – and the sooner the better. The available supply is only going to get smaller between now and August.
You May Also Like
Enter a zip code to see the weather conditions for a different location.


