Subscribe to Our Newsletters
National Hog Farmer is the source for hog production, management and market news
August 4, 2013

The new Swine Management Services (SMS) benchmarking program introduced at World Pork Expo incorporates the knowledge we have gained over the past four years in writing these articles. We’ve added a new parity benchmarking report with charts.
One of the concepts in the SMS Farm Benchmarking program is Potential for Improvement and is calculated for each farm. The new SMS Farm Benchmarking program uses 36 pigs weaned / mated female / year to calculate each farm's Potential for Improvement. This article will show how we came up with that number.
Like what you’re reading? Subscribe to the National Hog Farmer Weekly Preview newsletter and get the latest news delivered right to your inbox every week!
Table 1 shows data from 749 farms from the SMS Benchmarking program that average over 20 pigs weaned / mated female / year for the last 52 weeks. It shows the numbers for the top 1%, 2%, 5%, 10% and all farms. They are ranked by pigs weaned / mated female / year. The same farms are used in each column. As the data shows, the top 1% of the farms excel in total born / female farrowed at 14.59 pigs, versus all farms at 13.54 pigs, for a gain of 1.05 pig. Stillborns are at 0.47 pigs versus all farms at 0.95, which is a gain of 0.48 pigs. Pre-weaning death loss is at 5.3% for the top 1% versus all farms at 13.3%, for a drop of 8%. That puts piglet survival (100% - (Stillborn % + Pre-weaning death loss %) for the top 1% at 91.5% versus all farms at 79.7% for a gain of 11.8% more live pigs coming out of farrowing. The top 1% farms had pigs weaned / female farrowed at 12.97 pigs verses all farms at 10.63 pigs. That is an extra 2.34 pigs weaned per female farrowed. These top 1% farms had 2.52 litters / mated females / year which was a gain of 0.13 litters. That shows why the top 1% farms weaned an extra 7.5 pigs / mated female / year versus all farms.
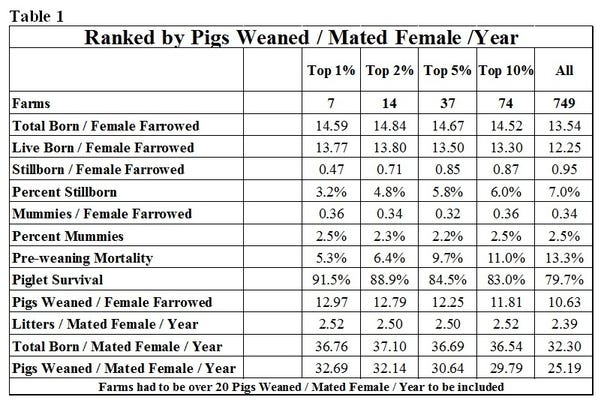
Table 2 shows the same farms and breakdowns, except they are ranked by the 12 production numbers individually. So the top 1%, 7 farms, in pigs weaned / mated female / year are not necessarily the same 7 farms in total born / mated female / year. Table 2 shows the top farm, the top 1%, 2%, 5%, 10% and all farms. This helps show what the top farm for each production number is at with Total Born / Female Farrowed at 16.34 pigs versus all farms at 13.54 pigs. Live born top farm at 14.67 pigs versus all farms at 12.25 pigs. The best farm in the data set had stillborns at a low 0.27 pigs per litter which was a low 1.7% versus all farms at 0.95 pigs stillborn per litter which was 7.0%. The data shows a very large difference in pre-weaning mortality with all farms having an average of 13.3% with the top farm at 2.2% which is an improvement of 11.1%. That puts the top farm at pigs weaned / female farrowed at 13.33 pigs versus all farms at 10.63 pigs. When we look at potential for pigs weaned / mated female / year, the top farm is all ready at 40.20 pigs total born / mated female / year.
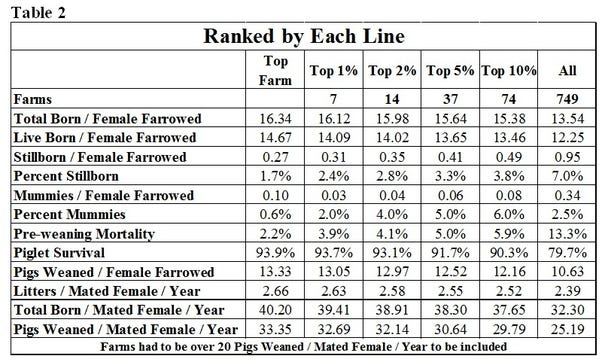
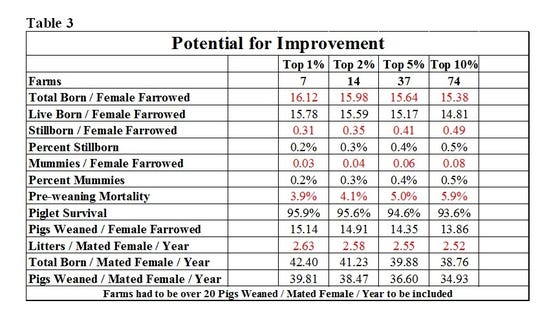
Table 3 shows how we calculated Potential for Improvement. We used total born / female farrowed, stillborn / female farrowed, mummies / female farrowed, pre-weaning mortality and litters / mated female / year to calculate the potential for total born / mated female / year and for pigs weaned / mated female / year. Pigs weaned / mated female / year calculated at 39.81 for the top 1%, 38.47 for the top 2%, 36.60 for the top 5% and 34.93 for the top 10%. We decided to use 36 pigs weaned / mated female / year as the standard that we would compare all farms to. This would mean you would have to be in the top 5% of all five numbers used in the calculations to be above 36. What this does show is that both the genetic potential and the management potential are there to wean many more pigs than the average producer is weaning today.
Previous Production Preview columns can be found at www.nationalhogfarmer.com.
Key Performance Indicators
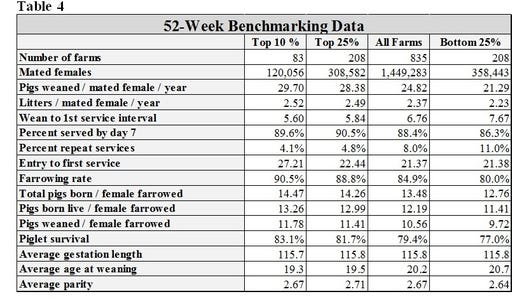
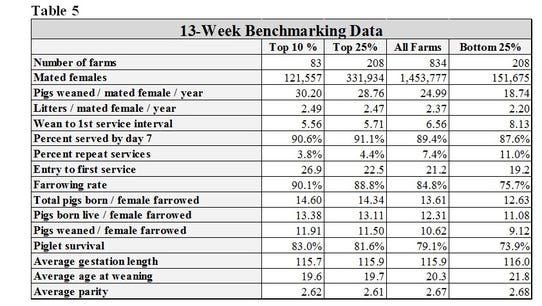
Tables 4 and 5 (below) provide 52-week and 13-week rolling averages for key performance indicators (KPI) of breeding herd performance. These tables reflect the most current quarterly data available and are presented with each column. The KPI’s can be used as general guidelines to measure the productivity of your herd compared to the top 10% and top 25% of farms, the average performance for all farms, and the bottom 25% of farms in the SMS database.
If you have questions or comments about these columns, or if you have a specific performance measurement that you would like to see benchmarked in our database, please address them to: [email protected] or [email protected].
You might also like:
Porcine Epidemic Diarrhea (PED) Virus: FAQ and Survival Tips
Evaluating Energy in Swine Diets
Survey Implicates Feed as Possible Cause of PEDV
You May Also Like
Enter a zip code to see the weather conditions for a different location.


