Subscribe to Our Newsletters
National Hog Farmer is the source for hog production, management and market news
January 13, 2014

We have been working on building the SMS Closeout Benchmarking Program for over three years and this will be the first time we are able to use information from the data set to write an article. SMS is ready now to accept data from other finisher closeout programs. Just like we do with sow data we will collect the raw data and then use our formulas to standardize the data from different closeout programs. There are currently 1,291 finishing closeouts in the SMS database and after applying filters to remove bad data and groups affected by major diseases we ended up with 1,192 closeouts which represent 2,352,309 pigs for this article. There are four separate databases in this program: nursery, finishing, wean-to- finish, and wean-to-finish double stock.
Figure 1 shows the layout for the SMS Closeout Benchmarking Program. An Executive Summary has been created for each producer which includes a chart for the SMS Production Index and 22 production charts showing the trend lines for the last 100 closeouts.
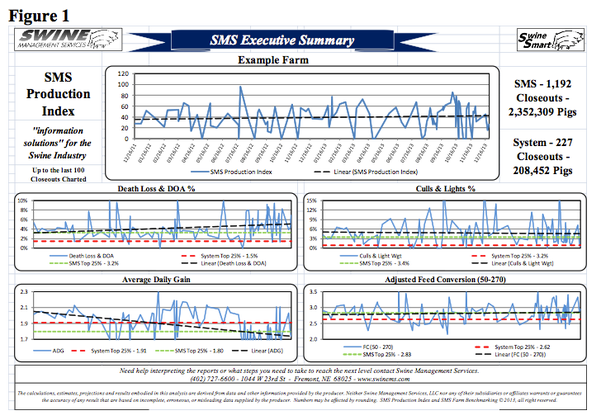
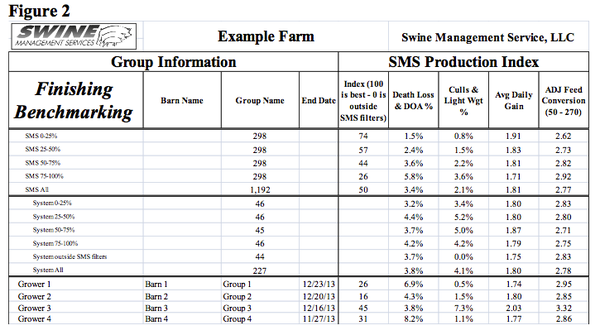
Figure 2 shows the Group Information Report containing the detailed information for each closeout with 62 columns of data displayed. At the top of the page note the Finishing Benchmarking tables with the SMS database and the System (producer) broken into Top 0-25%, 25-50%, 50-75%, 75-100% and the average for all.
As part of the benchmarking program’s ability to rank the individual closeout, we have created what we call the SMS Production Index (Table 1). It is comprised of 4 numbers:
Death Loss and DOA's by percentage
Culls and Lights by percentage
Average Daily Gain
Adjusted Feed Conversion (50-270 lb.)
We picked these numbers because they are very comparable numbers across all closeouts and are not affected by changes in markets and feed costs.
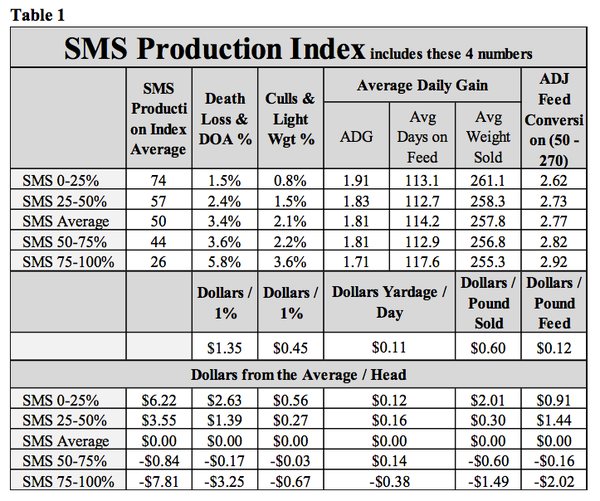
Death loss and DOA's have the number-one economic impact on the breakeven price. As you see in the table, Death Loss and DOA’s for the top 25% of farms in the SMS database are at 1.5% versus the bottom 25% of the farms (75-100%) at 5.8%. We performed a calculation in order to show the cost in loss of income caused by pig deaths. The average pig dies at 85 days, so with the value of a feeder pig at $70 + $50 feed +$8 yardage +$7 other cost = $135 invested in a dead pig, or $1.35 added to the breakeven for each 1% death loss for the group.
The second variable is “Culls and Lights.” When you consider pigs in this category are selling for an average $45 less than full-value market hogs, our calculations show that for each 1% in culls you can add $0.45 to the breakeven price.
Average Daily Gain (ADG) determines how much time a pigs spends in the finisher, or how much the pig weighs at marketing. The data shows the average cost for yardage is at $0.11 per pig, per day. And, currently the extra pound of pork equates to a sale price of $0.60 per pound. The data shows the Top 25% of the farms had ADG at 1.91 with average weight sold at 261.1 lb. The Bottom 25% (75-100%) was down to 1.71 for ADG and recorded market weight at 255.3 lb. We can calculate if a producer has fixed days in finishing, the market value difference is 5.8 lb. at $0.60, which equals $3.48 per pig.
Feed conversion is the fourth variable that makes up the SMS Production Index number. We know that there is a lot of variation in both the energy level of diets and diet form (meal or pellet). We feel that it would be very hard to get accurate information on calorie levels of diets used. However with the large variation in starting and ending weights in finisher closeouts, we decided to adjust the weights with starting weight to 50 lb. and ending weight at 270 lb. in order to have an Adjusted Feed Conversion number. For this article, we gave feed an average value of $0.12 per pound. Adjusted Feed Conversion for the Top 25% at 2.62, with the Bottom 25% (75-100%) at 2.92 means a drop to 0.30 lb. of feed per pound of gain. If a pigs gains on average 200 lb. x 0.30 lb. = an extra 60 lb. of feed at $0.12 per pound = $7.20 per head.
Table 1 uses the four variables in the SMS Production Index with added values. The table is set up to show the extra income or loss for the average. The difference in value between the Top 25% and Bottom 25% (75-100%) was $14.03 per pig. The table shows Death Loss & DOA’s as the biggest loss area, with the Top 25% at 1.5%, thus improving the value of these pigs by an extra $2.63 per pig.
At SMS, our mission statement is to provide “information solutions for the swine industry”. The addition of SMS Closeout Benchmarking reports will now allow us to talk about both sows and finisher performance. If your farm would like to be part of the either or both Benchmarking databases, or if you have suggestions on production areas to look at, feel free to e-mail or call us. We are looking forward to the year 2014 and being a part of the National Hog Farmer Weekly Preview team.
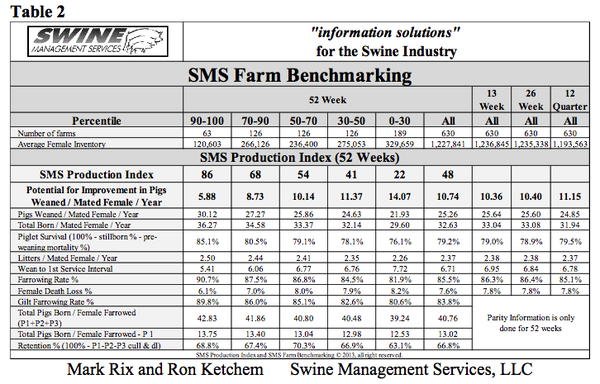
Table 2 provides the 52-week rolling averages for 11 production numbers represented in the SMS Production Index. The numbers are separated by 90-100%, the 70-90%, the 50-70%, the 30-50% and the 0-30% groups. We also included the 13-week, 26-week and 12-quarter averages. These numbers represent what we feel are the key production numbers to look at to evaluate the farm’s performance.
If you have questions or comments about these columns, or if you have a specific performance measurement that you would like us to write about, please contact: [email protected] or [email protected].
Previous Production Preview columns can be found at www.nationalhogfarmer.com.
You May Also Like
Enter a zip code to see the weather conditions for a different location.