Subscribe to Our Newsletters
National Hog Farmer is the source for hog production, management and market news
September 15, 2014

We old-timers could call this a “Timex” crop so far: Takes a licking, but keeps on ticking. Such was the news from the U.S. Department of Agriculture (USDA) last week. That name has been supported as well by reports that last week’s frost damage was not severe. It looks as though the record crop is nearly in the bin, or at least piled outside on the ground awaiting transportation.
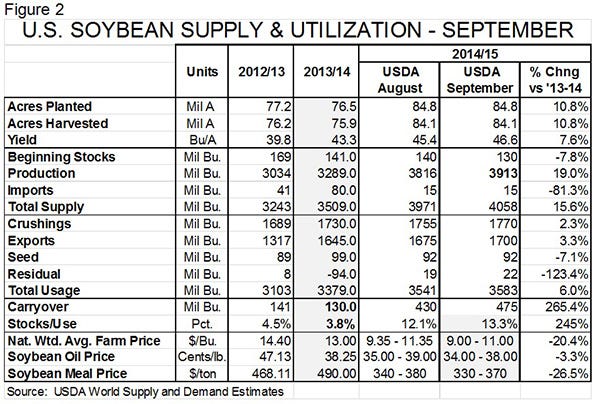
First, let’s look at the details from Thursday’s World Supply and Demand Estimates from the USDA. Figures 1 and 2 show the USDA’s supply and utilization figures for corn and soybeans.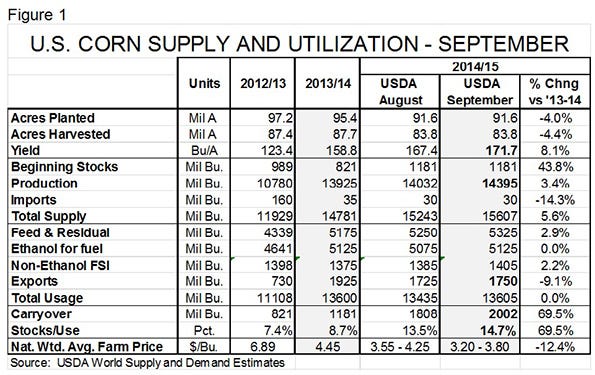
Some highlights are:
The USDA raised its estimated national corn yield to 171.7 bushels per acre from August’s estimate of 167.4. That was widely expected as crop conditions have remained favorable and August rains have helped fill kernels. History says the number will get larger yet. In 1994 and 2004, years that had yields that were 11% and 11.7% above trend yield; the final yield estimate was over 10 bushels higher than the August estimate. This September number is up just 4.3 bushels from last month.
The USDA did not fiddle with acreages, leaving both planted and harvested acres at their August levels. That’s normal. But some information surfaced from the Farm Service Agency suggesting the planted acres estimate may be too high. We’ll find out more on this in September.
The projected crop of 14.395 billion bushels will be record-large and put total supplies at 15.6 billion bushels. A little context: Our first 7 billion bushel crop was in 1978, 10 billion bushels were produced for the first time in 1994, 12 billion bushels in 2007.
All usage categories were increased slightly from their August levels. We think this is simply a function of price. Projected animal numbers have changed little, if any, since August but lower corn prices would encourage higher weights and, perhaps, more substitution for alternative feed ingredients. Lower-priced corn would make ethanol more competitive but plants are already running near capacity. Same arguments for non-ethanol food, seed and industrial usage and exports.
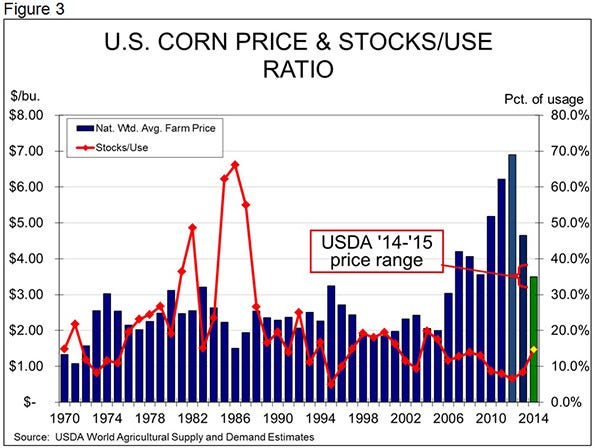
Projected carryout stocks of 2.002 billion bushels would be the highest since 2005. The projected year-end stocks-to-use ration of 14.7% is the highest since 2006 (see Figure 3). The national weighted average price in 2005-06 was exactly $2 per bushel. We aren’t going to that level but the $3.50 mid-point of the USDA’s forecast range would be the lowest since 2009-10.
The USDA increased its estimated soybean yield to 46.6 bushels per acre, a figure close to trade expectations. We doubt that this number will grow much more, if any, especially given this past week’s cold temperatures. Photoperiod is the key factor in soybean plant shutdown but let’s remember that 1 million of this year’s 5 million additional soybean acres were in North Dakota.
A total U.S. soybean crop of 3.9 billion bushels. I recall just a few years ago when the industry made a big to-do about its “out-there” goal of raising 3 billion bushels of beans. Now we are bumping 4 billion – and we need them all.
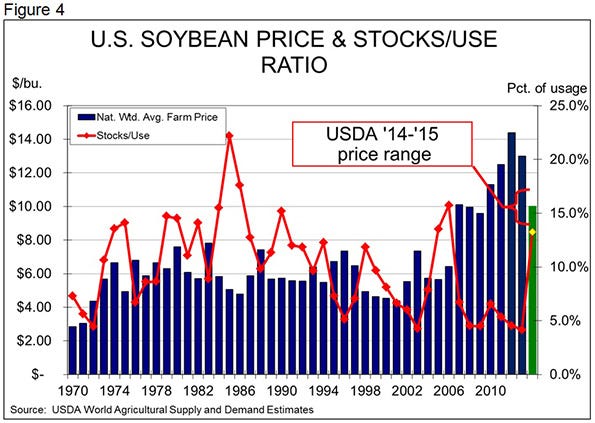
The USDA lowered this year’s carryout stocks again. The 130 million figure is less than the industry’s “pipeline” amount as evidenced by high meal prices in the past month. But that situation will flip completely given this crop with 2015 season-ending stocks now forecast at 475 million bushels, over 2.5 times as many as this year. The projected 2015 year-end stocks-to-use ratio is 13.3% – the highest since 2006 and the third highest since 1990.
Beans are still forecast to sell for $10 on average and meal is still in the mid-$350 per ton range. Those are cheaper but by no means cheap as world soybean demand remains strong.
What does this mean for hog production costs? Nothing but good for our standpoint. As can be seen in in Figure 5, corn and soybean meal futures prices as of Monday morning have average farrow-to-finish costs below $68/cwt. carcass in my model based on Iowa State University’s Estimated Costs and Returns series. That would be the lowest annual average cost since 2007’s $62.72.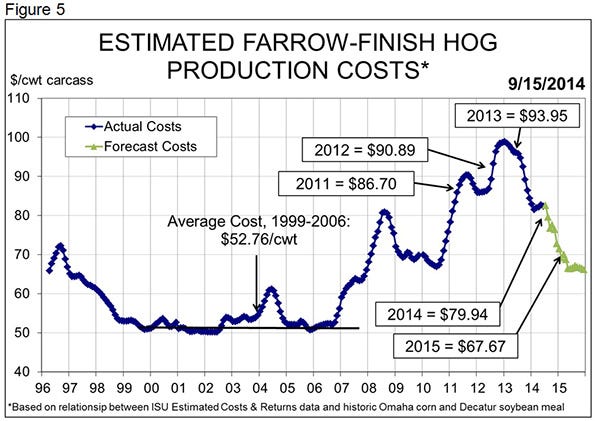
Can you go wrong locking in these kinds of costs? Perhaps, but not by much in our opinion. The USDA’s estimated corn yield may indeed grow but that expectation is, to a great degree, in this market already. There may be a few more birds in the bush but it may be time to put a few of them in hand.
Consider the hog margin situation, too. The August rally in Lean Hogs futures, when combined with these grain prices, have our estimate of average farrrow-to-finish profits back above $40 per head for 2015. October, November and December 2014 margins are at $54, $42 and $44 per head. Have you ever put those kinds of profits in the books during a fourth quarter?
I still think 2015 LH futures are underpriced because I still expect porcine epidemic diarrhea virus losses – though less than last winter – to be significant. Margins of these magnitudes should not be passed up without careful consideration. If you agree with my optimism about 2015 futures prices, consider buying put options. While you might think those premiums are high – and they frequently appear to be – consider them relative to the margin you are locking-in and they do not appear nearly so outrageous. 
You May Also Like
Enter a zip code to see the weather conditions for a different location.