Subscribe to Our Newsletters
National Hog Farmer is the source for hog production, management and market news
We decided to drill down a little deeper into the equation for pigs weaned/mated female/year (PW/MF/Y), which is litters weaned/mated female/year x pigs weaned/female farrowed. In this article, we will look at the litters weaned/mated female/year portion of the equation.
January 14, 2013

We decided to drill down a little deeper into the equation for pigs weaned/mated female/year (PW/MF/Y), which is litters weaned/mated female/year x pigs weaned/female farrowed.
In this article, we will look at the litters weaned/mated female/year portion of the equation.
Litters weaned/mated female/year has a biological cap of 2.60 litters. At 100% farrowing rate, 116 days of gestation + 19 days of lactation + 5 days wean-to-first service interval tallies up to 140 days; 365 days/year divided by 140 days = 2.60 litters weaned/mated female/year. This means that there are no returns to estrus and sows are culled the day they are weaned so there are no mated female non-productive days.
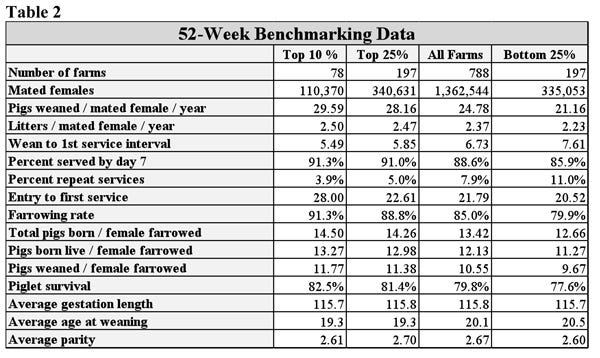
For a farm to achieve 30 PW/MF/Y, the simple equation is 2.5 litters x 12 weaned pigs/litter = 30 PW/MF/Y. Table 1 shows litters/mated female/year for “All Farms” was 2.36 in 2009 and 2.37 in 2012, a scant improvement of only 0.7%.
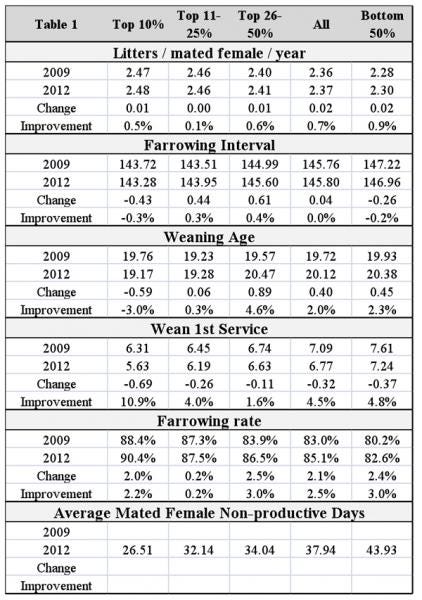
For all practical purposes, litters/mated female/year has remained very flat for all farm categories over the four years reflected in the Swine Management Services’ database (Table 1 and Chart 1). Why has this measure remained so flat ,and what can be done to improve this measure of sow performance?
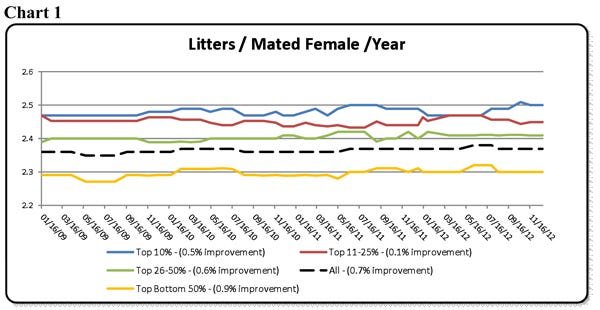
Let’s focus on five component numbers that affect litters weaned/mated female/year: farrowing interval, weaning age, wean-to-first service interval, farrowing rate and average mated female non-productive days.
Taking another look at Table 1, we see that farrowing interval for All Farms averaged 145.76 days in 2009 and 145.80 days in 2012 – not much change over the four-year period. However, looking closer at 2012 data, the Top 10% average farrowing interval was143.28 days, the Top 26-50% averaged 145.6 days, and the Bottom 50% averaged 146.96 days.
How much does the 3.68-day difference make? Chart 2 shows the farrowing interval four-year trend line is flat. The Top 10% farms have shaved 0.44 days off farrowing interval, while the Top 26-50% increased by 0.61 days over the four years. Clearly, this measure is not doing much to affect litters/mated female/year.
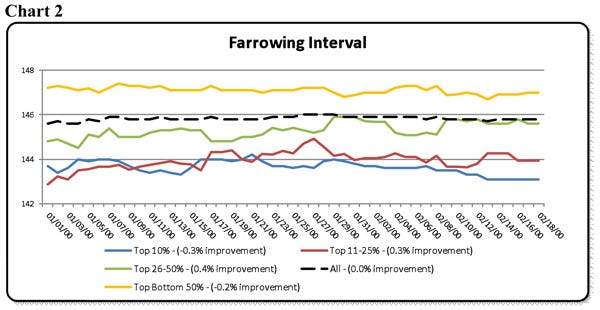
Next, we will look at weaning age trends from 2009 to 2012. All Farms averaged 19.72 days of age in 2009 vs. 20.12 days of age in 2012, an increase of 0.40 days. Chart 3 shows some month-to-month variation in weaning age during the four-year period. Weaning age peaked at 20.12 days of age for All Farms, with the Top 10% averaging 19.17 days. Logically, as weaning age goes up, litters/mated female/year will decline.
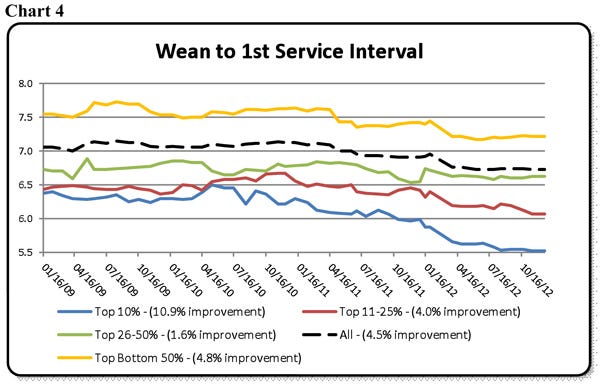
Another component of litters weaned/mated female/year is wean-to-first service interval. Looking again at Table 1, we see wean-to-first-service interval has dropped 0.32 days, a 4.5% improvement for All Farms during the four-year period. The Top 10% farms did a little better, declining from 6.31 days in 2009 to 5.63 days in 2012, a 10.9% improvement. As Chart 4 shows, this trend of fewer days to cycle after weaning started in mid-2011. We think this reduction reflects a trend to more aggressive feeding during lactation, as more and more farms add feed hoppers or automated feeding.
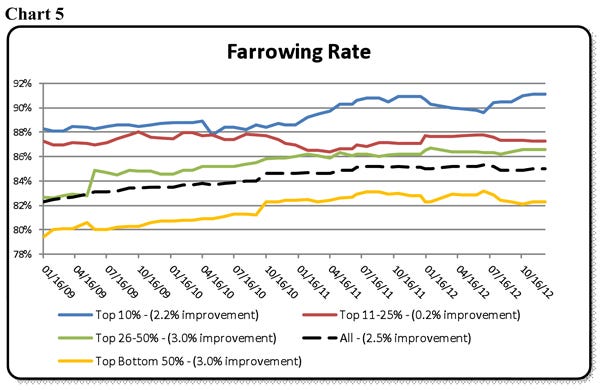
Farrowing rate has a lot of effect on litters weaned/mated female/year because it helps reduce open sow days. Looking again at Table 1, we see farrowing rate for All Farms at 83% in 2009 compared to 85.1% in 2012, a trend line improvement of 2.5% over four years (Chart 5). All breakout groups showed at least 2% improvement except Top 11-25% Farms, which improved just 0.2%. That 2.1% change in farrowing rate (85.1% vs. 83%) is equivalent to about 0.71 pigs weaned/mated female/year.
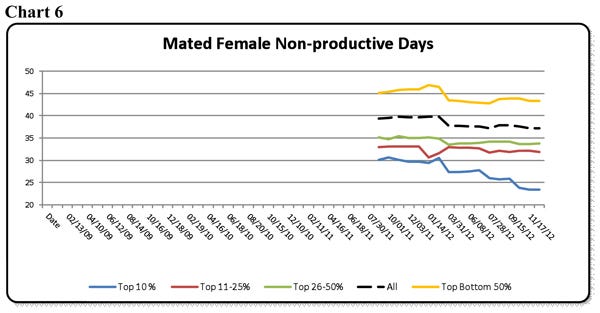
The last component we will look at is mated female non-productive days, a measure we began tracking in 2012. As Table 1 shows, All Farms averaged 37.94 non-productive days, while the Top 10% farms were at 26.51 days, 11.43 days better than the average. The Bottom 50% farms averaged 43.93 non-productive days (Chart 6). Wean-to-first service days contribute 16 days for the average farm and 13.9 days for the Top 10% farms. In other words, that leaves 27.9 days for the average farm to find returns to estrus, while the Top 10% take only 12.6 days to find returns. The Top 10% farms have a 5.3% better farrowing rate than the All-Farms average, and they find the returns to estrus sooner to save 11.43 mated-female non-productive days per year. If it costs $3.00/day to house a mated female, that is a $34.29 advantage/mated female. But we must remember that mated-female non-productive days are seasonal, lowest in early spring and peaking in late summer.
As you see, most of the components of litters/mated female/year show only small amounts of improvement over the last few years. If you are a Top-10% producer averaging 2.48 litters/mated female/year or better, there is not much more improvement you can make. Your challenge is to keep those numbers at those high levels. All the rest need to work on improving farrowing rate, finding returns-to-estrus sooner and lower wean-to-first intervals.
If they could improve litters weaned/mated female/year by 0.10 litters, it would improve pigs weaned/mated female/year by 1.1 pigs (assuming pigs weaned/female farrowed averaged 11 pigs). Therefore, the other part of the pigs weaned/mated female/year equation is pigs weaned/female farrowed, and that is the area that all farms should focus on to make faster improvement.
Past “Production Preview” columns can be found at www.nationalhogfarmer.com. Click on “newsletters,” then the respective date of the Weekly Preview issue you are interested in.
Key Performance Indicators
Tables 2 and 3 (below) provide 52-week and 13-week rolling averages for key performance indicators (KPI) of breeding herd performance. These tables reflect the most current quarterly data available and are presented with each column. The KPI’s can be used as general guidelines to measure the productivity of your herd compared to the top 10% and top 25% of farms, the average performance for all farms, and the bottom 25% of farms in the SMS database.

If you have questions or comments about these columns, or if you have a specific performance measurement that you would like to see benchmarked in our database, please address them to: [email protected]or [email protected].

You May Also Like
Enter a zip code to see the weather conditions for a different location.


