Subscribe to Our Newsletters
National Hog Farmer is the source for hog production, management and market news
July 8, 2013

May pork exports were better, although they still fell 4% short of last year’s level. Total U.S. pork exports for the month amounted to 430.6 million pounds, carcass weight equivalent. That compares to 396.8 million pounds in April and 448.2 million pounds one year ago (Figure 1).
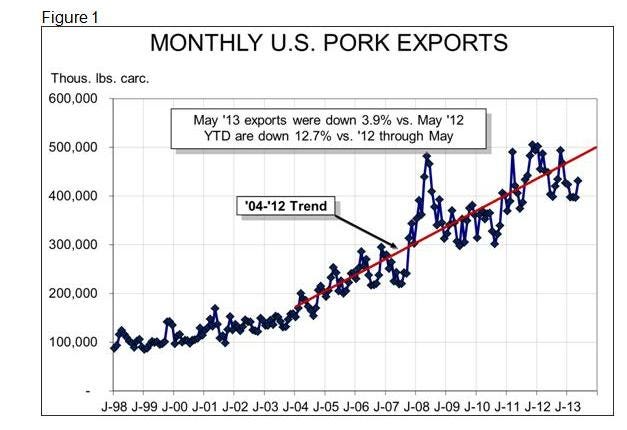
Figure 2 shows monthly pork exports in carcass weight equivalents for various U.S. pork markets. Obviously, Russia was the country with the largest percentage decline at 100% vs. one year ago. That decline was also the largest in tonnage terms at 37.8 million pounds. In fact, had Russia just taken half of last year’s total, May exports would have been very near as large as one year ago.
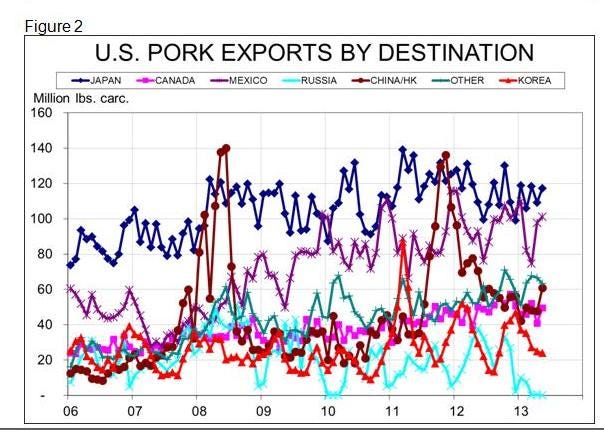
The other market that saw a significant year-on-year reduction in May was China/Hong Kong. Shipments there declined by 9.7 million pounds, carcass weight, or 13.8% from last year. May shipments, though, were 27% larger than those of April, suggesting that either more U.S. companies are producing and offering product from pigs not fed ractopamine or U.S. exporters are becoming more confident about China’s ill-defined “certification” requirements. Perhaps the high risks perceived by shippers in March and April have given way to more clearly understood rules for the new trading environment. Whatever the reason, May’s improvement is clear (Figure 2).
Exports to Canada were down 1% from one year ago and shipments to Korea were 18.5% lower than last year.
The good news was the growth for Japan (+7.3%) and Mexico (+5.9%). Shipments to the Caribbean and “Other” markets were also higher in May by 134% and 21%, respectively. “Other” markets, if considered collectively, are the fourth-largest destination for U.S. pork so far this year – larger than both China/Hong Kong and Korea.
Like what you’re reading? Subscribe to the National Hog Farmer Weekly Preview newsletter and get the latest news delivered right to your inbox every week!
Obviously, the situation with Russia will weigh heavily on how total U.S. exports finish out this year. There has been no news that indicates a change in Russia’s position regarding ractopamine, so the prospects remain bleak. China/Hong Kong will almost certainly remain far below last year’s pace. Steady improvement would be a victory, especially as we contemplate the impacts of the Smithfield-Shuanghui deal. The other at-risk situation is Japan where the yen had lost over 20% of its value before strengthening over the past three weeks. It remains well below the levels of last summer but has had little impact on exports – yet. Continued devaluation of the yen will eventually reduce the buying power of Japanese consumers.
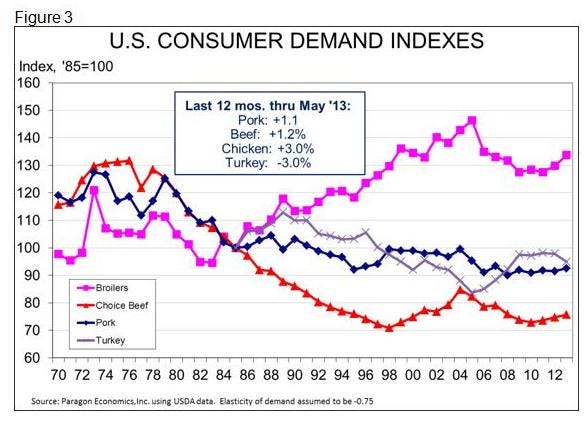
May’s export data also completes the information we need to ascertain U.S. domestic consumer-level demand indexes for all four major species (Figure 3). The indexes for the largest three remain positive for the 12 months that ended in May, with chicken demand leading the pack at +3%. Pork demand was 1.1% higher for the 12 months and beef demand was up 1.2%. Turkey demand continues to struggle as the industry has seen little impact of lower supplies on retail prices.
Per Capita Consumption
Total real per capita expenditures (RPCE) on meat and poultry during May amounted to $45.64. That figure is 1.7% higher than one year ago and 4.4% higher than the 2007-2011 average of $43.71. It brings year-to-date RPCE to $224.66, 2.4% higher than one year ago. A 0.9% decline in total domestic per capita consumption of beef, pork, chicken and turkey has been accompanied by a 3% increase in the weighted average retail price of all four species.
In spite of a few stock market hiccups associated with the Federal Reserve’s mentioning of winding down its QE-2 program of bond purchases, the economy continues to improve. Friday’s employment report showed 195,000 new jobs in the economy. But the unemployment rate remained at 7.6% as more people entered the job market, expanding the labor supply.
The National Restaurant Association’s Restaurant Performance Index (RPI) reached its highest level in 14 months in June. The 101.8 RPI was 0.8 points higher than in May and was driven by a sharp increase in the Current Situation Index component. That increase was, in turn, driven primarily by 2.4 point and 2.3 point increases in the indexes of same-store sales and customer traffic, respectively. All four component indexes of the Current Situation Index (the others are Labor and Capital Spending) are now above 100 for the first time since June 2007. This rebound in the restaurant sector may be a big factor in the improving demand indexes.
You might also like:
10 tips for Young Pork Producers
You May Also Like
Enter a zip code to see the weather conditions for a different location.


