Subscribe to Our Newsletters
National Hog Farmer is the source for hog production, management and market news
Parity benchmarking reports with charts are part of the new Swine Management Services benchmarking program.
July 8, 2013

The new Swine Management Services (SMS) benchmarking program introduced at World Pork Expo incorporates some of the knowledge we have gained over the past four years in writing these articles. We’ve added a new parity benchmarking report with charts.
Parity benchmarking will allow us to analyze all 800 farms in the SMS benchmarking database, by parity, versus the 130 farms in the SMS production analysis database. As part of the new benchmarking program, we have also developed a new SMS production index, which includes the 11 data points below – the bottom four are from parity benchmarking entries (Figure 1). The production index is designed to show farms their potential for improvement. An index score of 100 on the production Index equals 36 pigs weaned/mated female/year. The three bolded lines are included in this article.
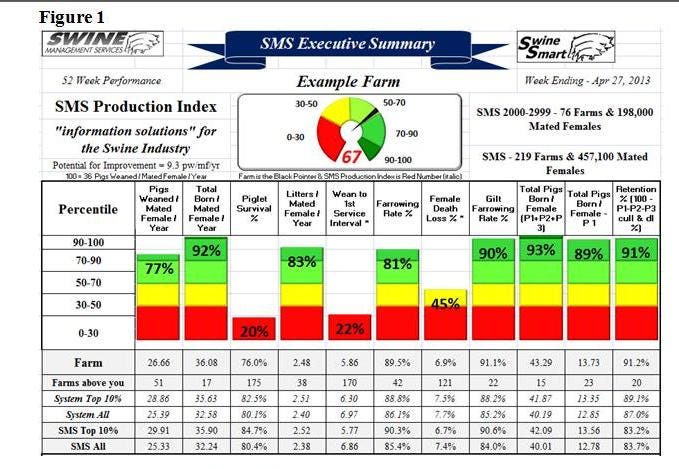
SMS Production Index data entries include the following. (Data entries in boldface are new):
· Pigs weaned/mated female/year
· Total born/mated female/year
· Piglet survival (100% - stillborn % - pre-weaning mortality %)
· Litters/mated female/year
· Wean-to-1st service interval
· Farrowing rate %
· Female death loss %
· Gilt Farrowing Rate %
· Total pigs born/mated female/year (P1+P2+P3)
· Total pigs born/female - P 1
· Retention to Parity 4 (100% - P1-P2-P3 cull & death loss %)
We are beta testing the program this summer with a full roll out planned for September. To date, we have converted 219 farms and 457,100 mated females to the new benchmarking database.
Like what you’re reading? Subscribe to the National Hog Farmer Weekly Preview newsletter and get the latest news delivered right to your inbox every week!
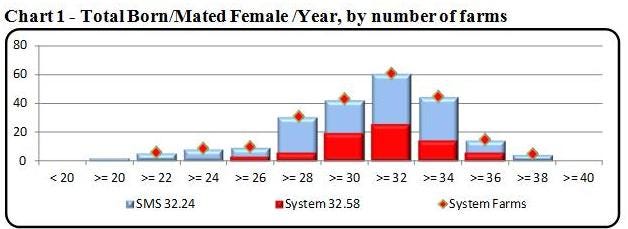
Most producers have not looked at total born/mated female/year in the past, nor do they have a feel for what a good number would be. To be above 30 pigs weaned/mated female/year requires at least 35 total born/mated female/year. The Top 10% farms are 35.90 total born/mated female/years. Chart 1 shows the distribution for 219 farms for total born/mated female/year, with a range from less than 20 pigs to farms with more than 38 total born/mated female/year.
Other than just looking at total pigs born/female, we felt it was important to break that number down, therefore in the new production index we added total pigs born for Parity1 (P1) females and total born/female farrowed for Parity 1 + Parity 2 + Parity 3.
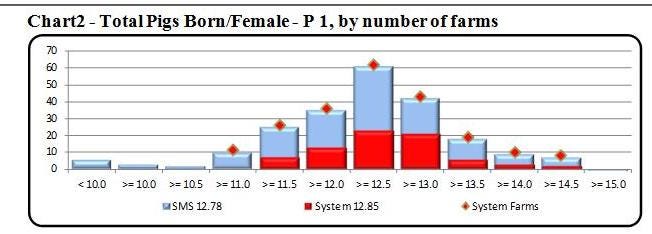
In the new data base of 219 farms, total pigs born/female for Parity 1, the average was 12.78 pigs, while the Top 10% averaged 13.56 pigs. As we have all been taught, the performance of the first litter born sets the potential for a female for life. The top farms in the data base with the high total pigs produced put a high priority on gilt development. These farms heat check gilts daily with lots of boar exposure, recording heat cycles, and making sure gilts get exposure to stalls before being bred. They plan when to breed those gilts based on number of cycles, body weight and body condition.
To show the variation between farms for total born for Parity1 females, take a look at Chart 2: Total Pigs Born/Female – Parity1, you will see farms range from less than 10 pigs born to the top farms at 15 pigs born. Some of this difference is genetics, however, proper gilt development is the key to maximizing performance.
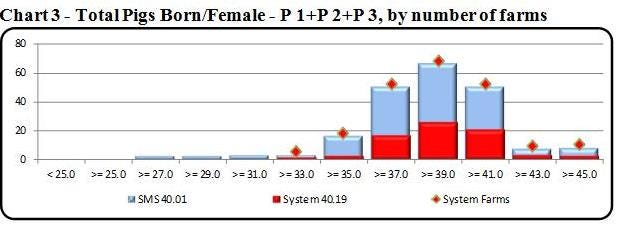
The other number added was total pigs born/female P1 + P2 + P3. Numbers show the Top 10% of farms at 42.09 pigs with average at 40.01 pigs for the three litters. Chart 3, Total Pigs Born/Female – P1+ P2 + P3, shows a distribution of 27 to 45+ pigs. Improving this number starts with gilt development, feeding of P1 females in farrowing, extra feed from weaning to breeding to reduce the P2 slump, low wean-to-service interval, multiple matings, and keeping younger females in good body condition in farrowing and through gestation.
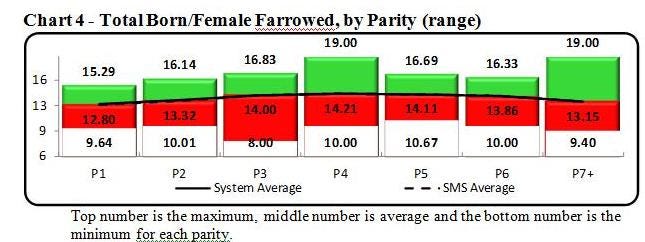
In Chart 4, Total Born/Female Farrowed, by Parity, we wanted to show that averages are not always to the best way to look at data. When you look at the range, you will see how much real variation there is in any data set. This chart is broken down by Parity P1 to Parity 6, with Parity 7 and older females. As parity increases, total pigs born improves and peaks at Parity 4. P1 average is 12.80 pigs. The best farm is at 15.29 pigs and the lowest is at 9.64 pigs – a difference of 5.65 pigs. An even larger spread is seen in Parity 4 females – 10 to 19 pigs.
As we move forward using data to improve management standard operating procedures to produce more pigs, how many pigs can a sow wean? Currently the goal is 30 or more with some farms able to produce 35 or more pigs/mated female/year. We hope the information in these articles help producers meet their goals.
Previous Production Preview columns can be found at www.nationalhogfarmer.com.
Key Performance Indicators
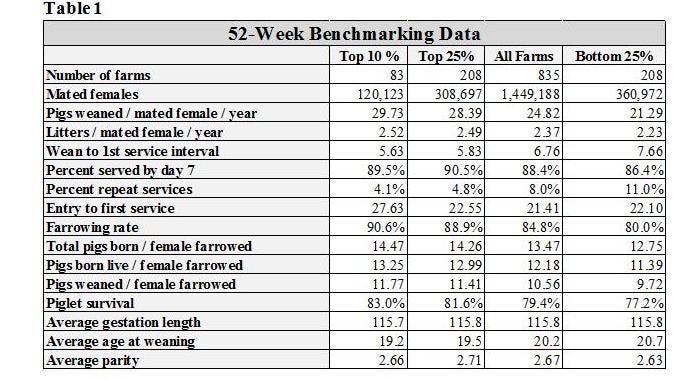
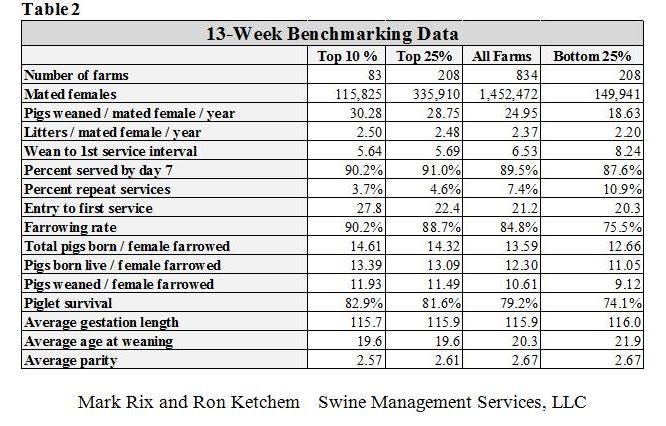
Tables 1 and 2 (below) provide 52-week and 13-week rolling averages for key performance indicators (KPI) of breeding herd performance. These tables reflect the most current quarterly data available and are presented with each column. The KPI’s can be used as general guidelines to measure the productivity of your herd compared to the top 10% and top 25% of farms, the average performance for all farms, and the bottom 25% of farms in the SMS database.
If you have questions or comments about these columns, or if you have a specific performance measurement that you would like to see benchmarked in our database, please address them to: [email protected]or [email protected].
You might also like:
10 tips for Young Pork Producers
You May Also Like
Current Conditions for
53°F
Mostly Cloudy
Day 72º
Night 50º
Enter a zip code to see the weather conditions for a different location.


