Subscribe to Our Newsletters
National Hog Farmer is the source for hog production, management and market news
Swine Management Services (SMS) celebrated its 10th anniversary in 2012. As we start a new decade and a New Year, we think it would be helpful to take another look at the performance measures that affect pigs weaned/mated female/year (PW/MF/Y).
January 7, 2013

Swine Management Services (SMS) celebrated its 10th anniversary in 2012. As we start a new decade and a New Year, we think it would be helpful to take another look at the performance measures that affect pigs weaned/mated female/year (PW/MF/Y).
Some commercial genetic suppliers are talking about getting two more pigs born/female farrowed. This would push the top farms to over 36 PW/MF/Y. Are you prepared to handle extra pigs in the farrowing house? History tells us most producers are not.
We have charted four years of data from the SMS benchmarking database and then compared the averages for 2009 to the averages of 2012 to measure the improvement in eight key performance indicators.
USDA has reported a 4.7% increase in pigs weaned/litter from 2009 (9.62) to 2012 (10.07). SMS data for the same time frame shows a 5.3% increase (9.99 to 10.52 pigs weaned/ mated female farrowed, 2009 vs. 2012). However, the increase is not evenly distributed over all the farms.
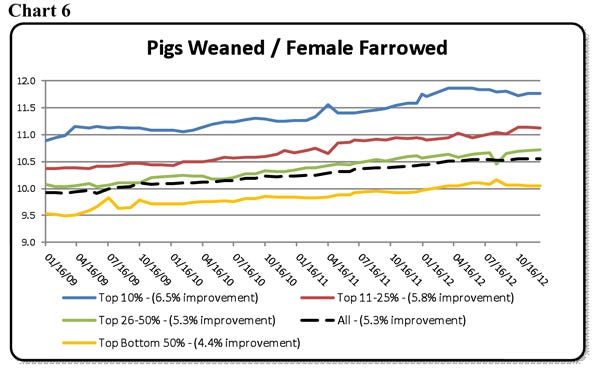
In Table 1, the Top 10% of SMS herds showed a 6.5% increase in pigs weaned/mated female/year (PW/MF/Y) and moving pigs weaned/female farrowed from 11.08 to 11.80 pigs, from 2009 to 2012. The Top 11-25% showed a 5.8% increase, the Top 26-50% showed a 5.3% increase, and the Bottom 50% showed a 4.4% increase in the comparison.
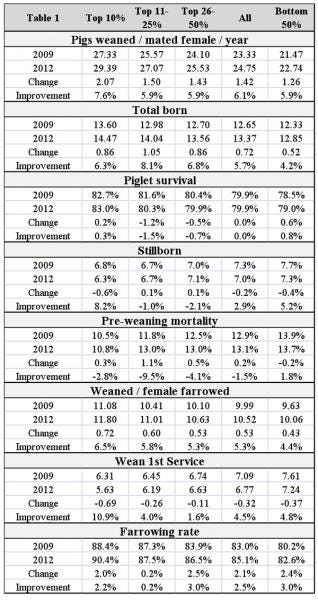
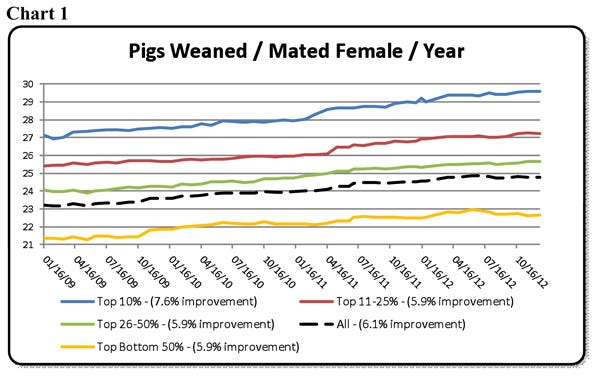
Chart 1 (PW/MF/Y) shows a steadily improving trend line, with “all averages” improving from 23.33 to 24.75 PW/MF/Y, a gain of 1.42 pigs or 6.1%. The Top 10% of farms improved 7.6%, moving from 27.33 to 29.39 PW/MF/Y, a 2.07-pig improvement. The Bottom 50% of herds only improved 1.26 PW/MF/Y, a 5.9% improvement, moving from 21.47 to 22.74 PW/MF/Y.
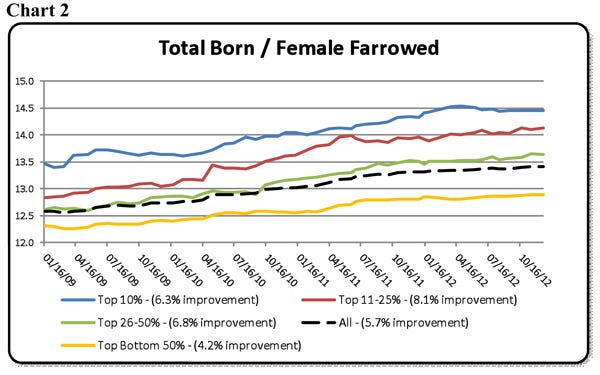
During that four-year period, total born/female farrowed improved only 5.7% for all average, moving from 12.65 to 13.37 pigs (Chart 2). The most improved segment was the Top 11-25%, which improved from 12.98 to 14.04 pigs, a gain of 1.05 pigs or 8.1%. The Top 10% of farms pushed their 2012 average to 14.47 pigs/female farrowed, a gain of only 0.86 pigs/female farrowed, but 1.62 pigs more than the Bottom 50% farms.
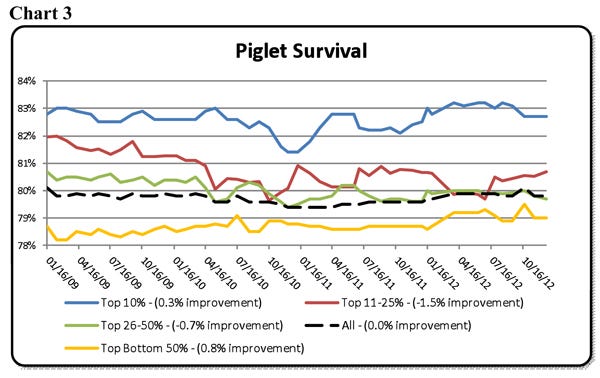
Are these farms saving more pigs after four years of working in farrowing to save extra pigs born? Chart 3, piglet survival (stillborns and preweaning mortality), shows the all-herds average unchanged for the period, holding at 79.9%. The Top 10% of farms improved by 0.3%, moving to 83%, whereas the Top 11-25% dropped from 81.6 to 80.3%, a 1.5% decline.
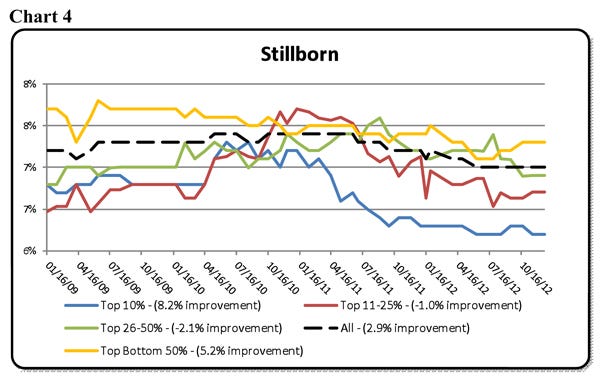
Looking solely at stillborn rates (Chart 4), we see some improvement by all groups for the last 18 months. The all-farm average went from 7.3 to 7.0%. The Top 10% of farms improved the most, with stillborns dropping from 6.8 to 6.3%, an 8.2% improvement. We know that several of these farms have added a second or third shift of farrowing room attendants.
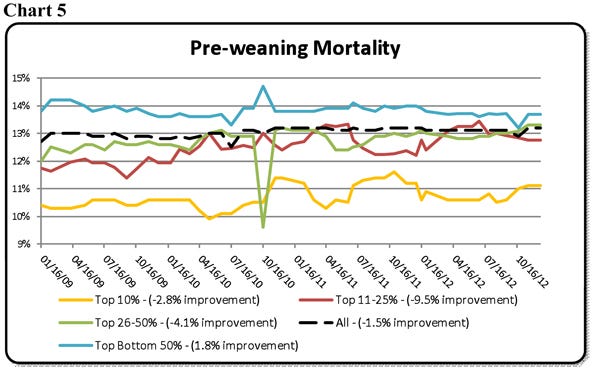
The other component of piglet survival is preweaning death loss. Chart 5 shows preweaning mortalities have increased from 12.9 to 13.1% in the all-farms average. The Bottom 50% farms showed an improvement of 1.8%, moving from 13.9% preweaning mortality to 13.7%. Both the Top 10 and Top 11-25% farms slipped from 10.5 to 10.8% and 11.8 to 13.0%, respectively – a 9.5% preweaning mortality increase for the Top 11 to 25%.
Clearly, not all of the extra pigs being born are being saved. Farms that are saving more pigs are focusing on Day 1 management by redefining the job of the Day-1 crew. This may involve towel drying pigs at birth, coating them with drying agents, or placing them in a hot box to get them dry and warmed up. We feel that getting the pigs dry and on a nipple soon after farrowing increases colostrum intake, which is a key to lowering preweaning death loss. Split suckling the litter on Day 1 helps ensure that all pigs are getting enough colostrum. Overall, the trend lines for PW/MF/Y have stabilized in recent quarters (Chart 6).
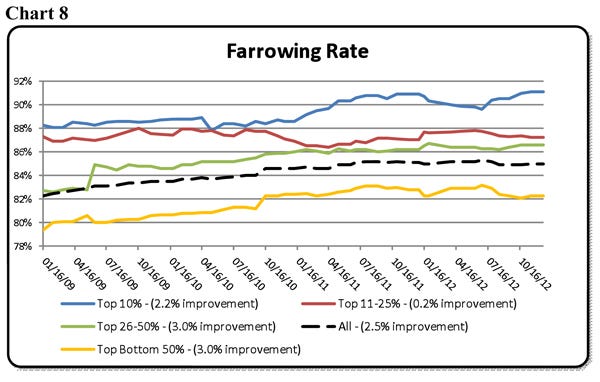
Other noteworthy trends are shown in Charts 7 and 8. Wean-to-first-service interval (Chart 7) has declined over the last 15 months. The all-farms average has dropped from 7.09 to 6.77 days over the last four years, a drop of 0.32 days or a 4.5% improvement. Interestingly, the Top 10% farms improved 10.9%, shaving 0.69 days off the average (6.31 vs. 5.63 days). We feel some of the improvement has come from weaning older pigs. However, most of the improvement was a result of more aggressive feeding in lactation by adding automated feeding systems or storage hoppers so sows are being full-fed starting earlier in lactation.
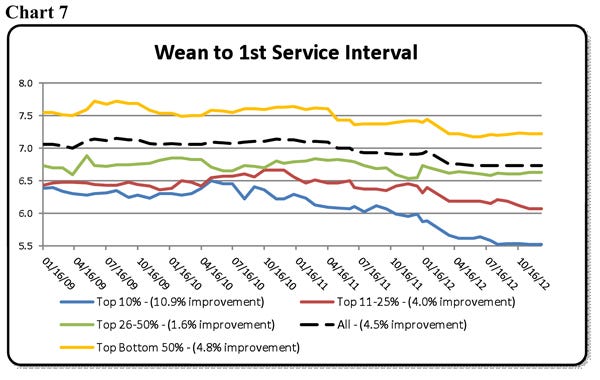
Chart 8, farrowing rate, shows the all-farm average going from 83.0 to 85.1%, a gain of 2.1%. The Top 10% farms had a farrowing rate of 90.4% compared to the Bottom 50% at 82.6% in 2012.
We do not know what kind of improvement the genetic companies have for total born for the next four years.
Six of the performance indicators showed improvement, while preweaning death loss and piglet survival did not improve. With more pigs being born, more effort is needed to save as many of those pigs as possible. Now would be a good time to review your Day-1 pig management protocol and make the changes necessary to reduce preweaning mortalities.
Past “Production Preview” columns can be found at www.nationalhogfarmer.com. Click on “newsletters,” then the respective date of the Weekly Preview issue you are interested in.
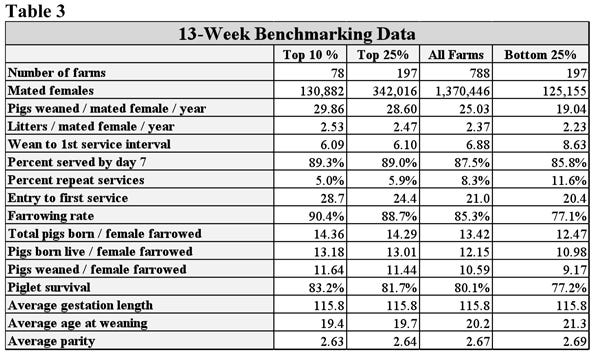
Key Performance Indicators
Tables 2 and 3 (below) provide 52-week and 13-week rolling averages for key performance indicators (KPI) of breeding herd performance. These tables reflect the most current quarterly data available and are presented with each column. The KPI’s can be used as general guidelines to measure the productivity of your herd compared to the top 10% and top 25% of farms, the average performance for all farms, and the bottom 25% of farms in the SMS database.

If you have questions or comments about these columns, or if you have a specific performance measurement that you would like to see benchmarked in our database, please address them to: [email protected]or [email protected].
You May Also Like
Enter a zip code to see the weather conditions for a different location.