Subscribe to Our Newsletters
National Hog Farmer is the source for hog production, management and market news
Gilt development is a serious matter. Top farms manage gilts to maximize Parity 1 performance.
April 8, 2013

Last month, we began looking at female retention. The farms in the Swine Management Services database have a large variation in days to first service for gilts, ranging from one day to as high as 235 days. Much of the difference is due to how farms pay for their sow record keeping programs. Some are based on female inventory, so gilts are entered when bred to save a few pennies. A lot of very valuable information on gilt retention is being lost in those circumstances and it makes it more difficult to compare farms for culling rate, death loss, replacement rate and gilt retention.
The data set used for this article includes 87 farms, represents 197,409 females, for an average of 2,270 females/farm. For the most recent 52 weeks records were available, these farm have entered data on101,414 gilts. The replacement rate was at 51.4% with culling rate at 44.8% and female death loss at 7.2%. To see if there is difference in farrowing rate, total born per female farrowed, piglet survival (100% - [stillborn % + pre-weaning death loss]), and pigs weaned/female farrowed.
In Table 1 we show production data for the 87 farms, plus we broke out nine farms that report entry-to-first service at one day or less and five farms with entry-to-first service at 150 days or more.
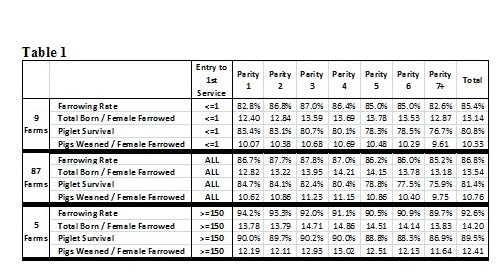
The nine farms reported gilt culling at 3.7%, gilt death loss at 0.7%, for a total culling rate 41.5% and total death loss at 7.7%. The five farms described above had entry-to-first service higher than 150 days with gilt culls at 13.9%, gilt death loss at 1.3%, with total culls at 61.6% and total death loss at 6.7%. The difference is having gilts in inventory much longer, so more deaths and culling are recorded.
Table 1 also breaks out the 87 farms by parity and four production areas: farrowing rate, total born/female farrowed, piglet survival rate and pigs weaned/female farrowed.
Farrowing rate for Parity 1 (P1) female is at 86.7%, with all parities averaging 86.8%. Total pigs born starts at 12.82 pigs/litter for P1, peaks at Parity 4 at 14.21 pigs/litter, with an all-parity average at 13.54 pigs. Pigs weaned/female farrowed for P1 is 10.62 pigs/litter, climbs to 11.23 pigs/litter at P3, then drops to 9.75 pigs/litter for P7+, and average 10.76 weaned pigs/litter for all females.
While the sample size for the nine farms and five farms in this comparison is small, they do illustrate some differences. The nine farms with entry to first service at one day or less had average farrowing rate of 85.4%, total born/female farrowed for P1 at 12.40 pigs/litter and peaked at P5 with 13.78 pigs/litter and averaged 13.14 pigs/litter, total born. Pigs weaned/female farrowed starts with P1 at 10.07, climbs to 10.69 at P4, and then drops off to 9.61 for P7+ females with an overall average at 10.33 pigs.
For the five farms with entry-to-first service of 150 days or more, averages are better. Total born/female farrowed improved to 14.20 pigs/litter for all females, while P1 females averaged 13.78 pigs/litter females, peaking at 14.86 pigs/litter for P4 females. Farrowing rate is improved with an average at 92.6%. P1 female farrowing rate is 94.2%. Pigs weaned/female farrowed averaged 12.41 pigs with P1 females averaging 12.19, P4 at 13.02 pigs and P7+ higher females averaging 11.64 pigs/litter.
Like what you're reading? Subscribe to the National Hog Farmer Weekly Preview newsletter and get the latest news delivered right to your inbox every Monday!
What are those five farms doing with females during the 150+ days, entry-to-first service? These farms are taking gilt development very seriously. Most of these farms have set aside an area where gilts are tracked, daily boar exposure is provided, heat cycles are recorded, gilts are exposed to stalls whenever possible before being bred. Generally, gilts are bred after one or two skipped heats, they are acclimated in a gestation stall, weigh at least 300 lb. and, if possible given extra feed for 10-14 days before breeding. Other farms do these things but may not be recording the information to ensure they are being done every day.
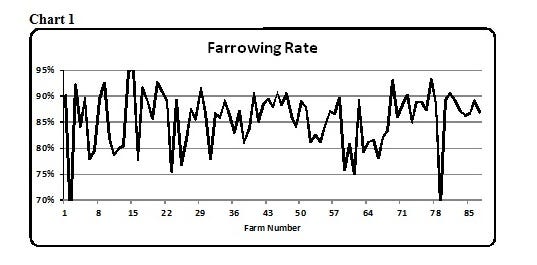
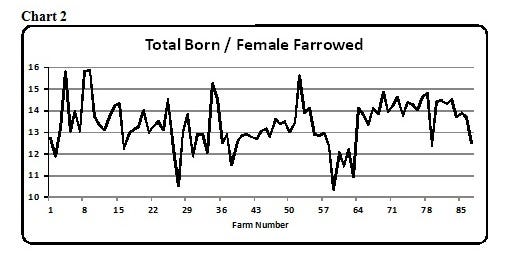
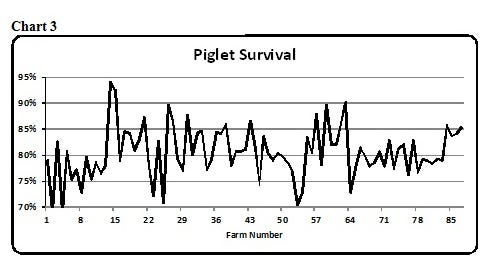
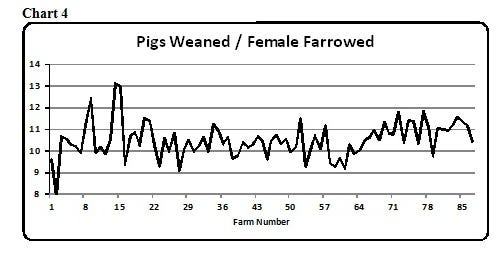
In Charts 1 through 4, the 87 farms are represented on the X-axis. Clearly, there is wide variation from farm to farm for farrowing rate (range, 70 to 96%; average 86.8%), total born/female farrowed (range 10.4 to 15.9 pigs; average, 13.54 pigs), piglet survival (range 70 to 94%; average 81.4%), and pigs weaned/female farrowed (range 13.1 to 8 pigs; range, average, 10.67).
How is your farm handling gilt development? The top farms are in control of the gilts they are breeding to maximize performance in Parity 1.
Past “Production Preview” columns can be found at www.nationalhogfarmer.com. Click on “newsletters,” then the respective date of the Weekly Preview issue you are interested in.
Key Performance Indicators
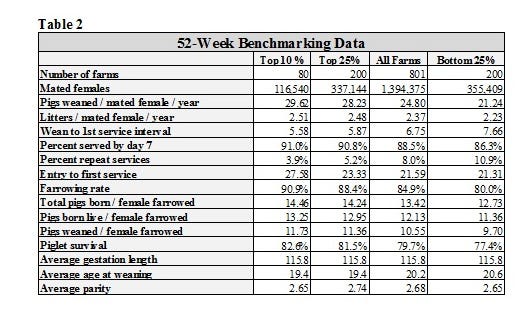
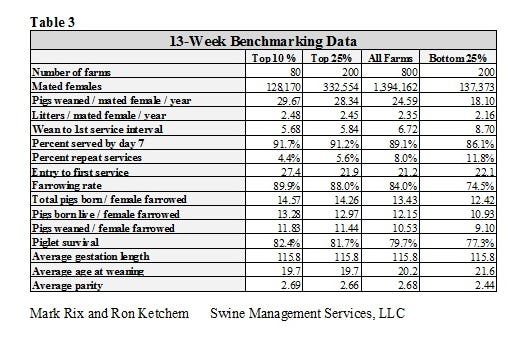
Tables 2 and 3 provide 52-week and 13-week rolling averages for key performance indicators (KPI) of breeding herd performance. These tables reflect the most current quarterly data available and are presented with each column. The KPI’s can be used as general guidelines to measure the productivity of your herd compared to the top 10% and top 25% of farms, the average performance for all farms, and the bottom 25% of farms in the SMS database.
If you have questions or comments about these columns, or if you have a specific performance measurement that you would like to see benchmarked in our database, please address them to: [email protected] or [email protected].
You might also like:
You May Also Like
Enter a zip code to see the weather conditions for a different location.