Subscribe to Our Newsletters
National Hog Farmer is the source for hog production, management and market news
May 5, 2014

What production numbers should producers focus on to make the jump to 30+ pigs weaned/mated female/year? As we work with more farms that have the goal of getting to 30+ pigs we wanted to look at what production numbers need to be improved to go from 25 to 30+ pigs weaned/mated female/year.
Information from farms achieving 30 pigs or more weaned/mated female/year was compiled as a basis for Table 1. This information came from 32 farms with 49,700 mated females. The table compares farms achieving 30 pigs or more against farms recording 22 to 29 pigs weaned/mated female/year (shown in the table as >=22 & <30 pigs). The table represents 598 farms with 22 to 29 pigs. These farms have an inventory of 1,060,600 mated females.
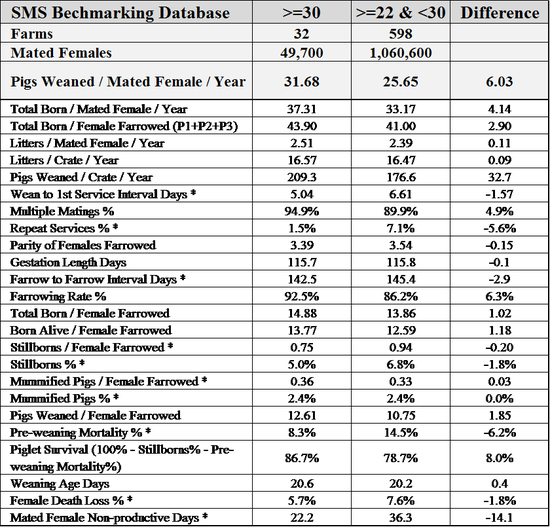
The quick equation for calculating Pigs Weaned / Mated Female / Year = (litters / mated female / year) multiplied by (pigs weaned / female farrowed). Example: 2.51 (litters / mated females / year) X 12.61 (pigs weaned / female farrow) = 31.65 pigs.
What makes up the first part of the equation: Litters / Mated Female / Year? This number is affected by farrowing rate, wean-to-first service interval, multiple matings, repeat services, gestation length, farrow-to-farrow interval, weaning age, and mated female non-productive days.
We feel the the key driver of this group is wean-to-first service interval. In Table 1 wean-to-first-service interval for the 30+ pigs weaned/mated female/year farms were at an average of 5.04 days, with the other farms at 6.61 days, for a drop of 1.57 days to cycle.
We know that the sooner a weaned sow cycles, the more fertile she is, which improves farrowing rate with 30+ pigs weaned/mated female/year farms at 92.5% versus other farms at 86.2%. By improving farrowing rate, repeat services are lower at 1.5% versus 7.1%.
You will also note that the percentage of multiple matings are higher for the 30+ pigs weaned/mated female/year farms at 94.9% versus 89.9%. In looking at farrowing rate by parity, the 30+ farms have higher multiple matings for P0 females, which helps to improve the farrowing rate for the farms. If we have a reduction in repeats there is also a drop in mated female non-productive days for the farms, which results in less than 30 pigs to an average of 36.3 to 30+ pigs on farms at 22.2 days.
The second half of the equation is pigs weaned / female farrowed. We use this number versus pigs weaned per litter weaned, which would include nurse sows. There is a lot of variation on how many nurse sows are used in some farms so the comparison would be inaccurate.
To get to pigs weaned / female farrowed you have to start with total born / female farrowed. In Table 1 you see that the farms with 30+ pigs weaned are at 14.88 pigs versus the others at 13.86 pigs, which is a difference of 1.02 pigs. You will see a new number called, “Total Born / Female Farrowed (P1 + P2 + P3)” in Table 1. The farms that do a better job of gilt development will usually see a higher total born for P1 females, but sometimes see the drop in numbers for P2 and back up on P3.
In Table 1 we see that the “Total Born / Female Farrowed (P1 + P2 + P3)” numbers are 2.9 pigs higher for the 30+ farms, which are at 43.90 pigs versus 41.00 pigs. That 1.02-pig advantage has been increased by improved management of the gilts and P1 females. When you compare “Pigs Weaned / Female Farrowed,” you see the 32-30+ pigs’ farms at 12.61 versus 10.75 pigs. That is a difference of 1.86 pigs. The top 32 farms have also figured out how to save more of those extra pigs in the farrowing rooms, with stillborns being 1.8% lower at 5.0% and pre-weaning mortality at 8.3% versus the farms with less than 30 pigs at 14.5%.
When we combine these numbers in to our equation called, “Piglet Survival,” there is a difference of 8%, putting farms with 30+ pigs at 86.7%, and farms with less than 30 pigs at 78.7%.
What does 8% difference in piglet survival mean on a 2,500-sow farm? We see that 2,500 sows multiplied by 25.65 pigs = 64,125 pigs annually. The extra 8% is an additional 5,130 pigs per year for an increase to 69,255 pigs per year. That is an extra 2.05 pigs weaned / mated female / year.
What are these farms doing to save more pigs? Most have transitioned to multiple shifts in farrowing, which may be two shifts covering 16-20 hours per day, up to some at 24 hours / day 7 days per week. They have also redefined Day 1 pig care, which involves monitoring sows during farrowing, helping when needed, getting pigs dry, making sure they get attached to a teat, doing split suckling of pigs as soon as the sow is done farrowing, doing minimum fostering and making sure sows are healthy and eating well.
There are a few other numbers to compare. Weaning age is at 20.6 days for farms achieving 30+ pigs, versus 20.2 days for farms getting less than 30 pigs. Female death loss is at 5.7% for 30+ farms compared to 7.6%. Mummified pig percentage is the same at 2.4%. Litters / crate / year is at 16.57 for the 30+ farms, versus 16.47, showing most farms are using their facilities equally. However, when you look at Pigs Weaned / Crate / Year the 30+ farms were at 209.3 pigs compared to the farms with less than 30 pigs at 176.6 pigs.
How do your numbers compare to the 32 farms at 30+ pigs in Table 1? You need to take these numbers and sit down with your farm crew and see what areas you can work together on improving in order get to 30+ pigs.
SMS Production Index
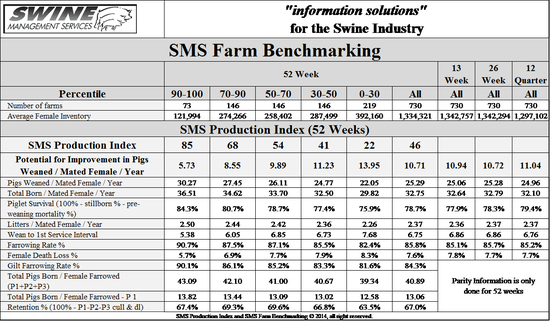
Table 2 provides the 52-week rolling averages for 11 production numbers represented in the SMS Production Index. The numbers are separated by 90-100%, the 70-90%, the 50-70%, the 30-50% and the 0-30% groups. We also included the 13-week, 26-week and 12-quarter averages. These numbers represent what we feel are the key production numbers to look at to evaluate the farm’s performance.
At SMS, our mission statement is to provide “Information solutions for the swine industry.” We feel with the creation of the new Farm Benchmarking database we now have more detailed information to share with the swine industry. If your farm would like to be part of the Farm Benchmarking database, or if you have suggestions on production areas to look at, feel free to e-mail or call us. We enjoy being a part of the National Hog Farmer Weekly Preview team.
Previous Production Preview columns can be found at www.nationalhogfarmer.com.
If you have questions or comments about these columns, or if you have a specific performance measurement that you would like us to write about, please contact: [email protected] or [email protected].
You May Also Like
Enter a zip code to see the weather conditions for a different location.


