Subscribe to Our Newsletters
National Hog Farmer is the source for hog production, management and market news
September 30, 2013

Well, uh, let’s see. That’s interesting. And that, too. How can that be?
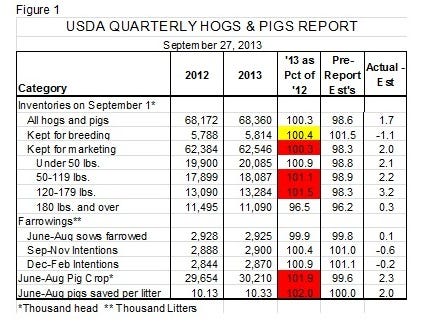
I think that pretty well sums up the reactions of most observers upon the release of USDA’s quarterly Hogs and Pigs Report on Friday. The key national numbers in the report are shown in Figure 1. The yellow highlighted figure indicates a number below the range of analysts’ pre-report estimates. Red highlights are for numbers above the range of pre-report estimates.
A few of the key pre-report expectations and the report numbers that correspond to them are:
· Expectation: The breeding herd would be larger by 1.5%. Well, the herd is larger but, according to USDA, only slightly so at 5.814 million head. That is just 0.4% more than last year and 1.1% SMALLER than the June 1 herd of 5.882 million head. U.S. sow slaughter has been down 7.4% since the week ending July 6. Adjusting for changes in imports from Canada does not change the number. Gilt slaughter as a percentage of total barrow and gilt slaughter has averaged 49%. That compares to 50% last year when feed costs were so high and 49.5%, on average, for the past 10 years. The sow slaughter number – and record high sow prices – suggest more than 0.4% growth. The gilt numbers add fuel to that fire as anything below about 49.5% is usually expansionary.
· Expectation: Porcine Epidemic Diarrhea (PED) virus has caused some major death losses and should impact the pig crop, under-50 lb. and, perhaps 50-119-lb. inventories. I x-nay on all of those! The June-August pig crop was pegged at a record-large (for the quarter) 30.21 million, 1.9% higher than last year’s then-record. The under-50-lb. inventory is up 0.9% and the 50-119-lb. is up 1.1%. And what’s more, the average litter size was a record 10.33 pigs. What about all of those preweaned pigs that died in Oklahoma and other places as a result of PED virus? If 10.33 survived, what would the number have been without PED virus? The 10.33 pigs per litter is 2% larger than last year. The largest EVER year-on-year gain in litter size was 3.2%. Did PED virus only kill 1.2% of the June-August pig crop? That number looks reasonable but it would be working off of an extraordinarily large increase in litter size. We don’t think that is likely with a pretty stable sow herd and falling feed costs.
· Expectation: Market herd numbers would be lower than one year ago. Analysts expected the number of growing hogs to be nearly 2% lower than last year. The U.S. Department of Agriculture (USDA) says the number was 62.546 million, 0.3% higher than last year. And the distribution is a bit odd with 180 lb.-and-over category down 3.5% (very close to expectations) and the middle-weight categories up over 1%.
· Expectation: A larger breeding herd would put farrowing plans sharply higher than last year. Sep.-Nov. and Dec.-Feb. intentions are higher but not nearly as high as a 1.5% larger breeding herd would have yielded. The 100.4% and 100.9% of year-earlier levels for those two quarters, respectively, are actually very much in line with the 100.4% for the breeding herd. All three are just lower than expected.
Like what you’re reading? Subscribe to the National Hog Farmer Weekly Preview newsletter and get the latest news delivered right to your inbox every week!
So what do we make of these numbers? First, they are the ones being traded today and until the point where they prove to be wrong. Millions of dollars have been lost betting against USDA numbers, so be a contrarian at your own risk.
That the numbers were a surprise is a given. But today’s futures market declines of generally $1.00 to $1.50/cwt. for futures contracts through May suggest that traders aren’t completely buying them. Differences of 2% and more relative to expectations usually cause limited price moves.
Figure 2 shows my expectations for weekly hog slaughter based on this report. I have done some “fudging” to smooth the transition from recent lower-than-expected slaughter levels to the year-on-year increases suggested by the report. My forecasts give me commercial slaughter of 30.616 million head in Q4, up 0.6% from last year and then quarterly year-on-year increases of 2.9%, 1.7% and 2% in quarters 1 through 3 of 2014.
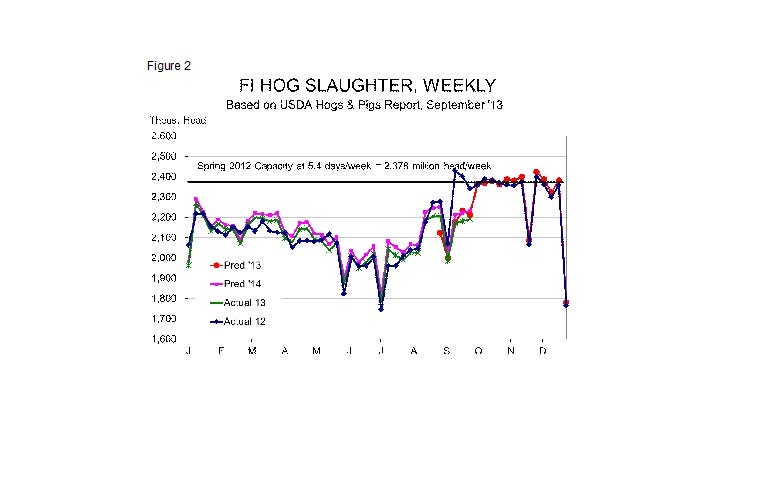
Not surprisingly, those increases will put some pressure on hog prices but prices will remain well above forecast breakeven cost levels! I have national net negotiated weighted average prices averaging $84 to $86 for the fourth quarter, $80 to $84 for Q1 2014 and then $84 to $88 in Q2 and $90 - $94 in Q3.
You might also like:
High Hog Prices Negated by Feed Costs
You May Also Like
Enter a zip code to see the weather conditions for a different location.


