Subscribe to Our Newsletters
National Hog Farmer is the source for hog production, management and market news
Benchmarking sow farms is easy to do compared to benchmarking nursery, finishing and wean-to-finish closeouts.
May 4, 2015

Benchmarking sow farms is easy to do compared to benchmarking nursery, finishing and wean-to-finish closeouts. There are 20+ sow record programs available, they may calculate some numbers differently, but they all collect the same data for each sow: matings, farrowings, weanings, piglet deaths, etc. That is not true for growing pigs. There are multiple computer programs plus thousands of different spreadsheets. The problem is not all producers collect and record the same data. Here are some numbers we feel are important data to collect.
Death loss by date, reason and estimated weight
Cull and light pigs by head, weight and dollars received per head
DOA’s during trucking by head and weight
Feed ingredients by ration, pounds and dollars
Feed medications type, pounds and dollars
Feed preparation and deliver dollars
Cost of pigs (weaned pigs or feeder pigs), including a transfer cost if the pigs are moved from another barn or out of a barn
Animal health, injectable, water treatments, vaccines, etc. by quantity and dollars
Other cost including trucking to and from facilities, facility or contract cost, etc.
When SMS launched the NEW SMS Closeout Benchmarking in 2014, it included a NEW concept with the SMS Production Index for ranking closeouts; this allows you to measure improvement over time and sort closeouts by performance. The SMS Production Index ranks each individual closeout by % Death Loss and DOA’s, % Cull and Light Pigs, Average Daily Gain and Adjusted Feed Conversion and give it an index number for 0-100. We also use these numbers to calculate an Opportunity Dollars which is compared to the top 25% of the closeouts in the SMS data base as ranked by the SMS Production index.
So far we have received data from over 18,000,000 pigs however we were not able to use approximately 3,000,000 pigs, which was 16%, because the data was really bad after it was filtered. We ended up imported 9,973 closeouts with 15,189,763 pigs. To help sort out closeouts outside of normal ranges the SMS Closeout Benchmarking program also has a filtering system built into it. For example death loss must fall within 0 – 15%, inventory variance at the end must fall within -5 to +5%, nursery feed conversion from 1.0 to 3.0, finisher feed conversion from 2.0 to 3.8 and wean to finish from 1.8 to 3.5. As you can see the ranges are rather large, but this filtered out another 925 closeouts, 1,375,475 pigs or 9.1%. The range by producer we see on bad data ranges from 0% to 60% of the closeouts sent.
The question we ask is anyone looking at and checking the closeouts to make sure the data is good. Every producer should have a check list with normal ranges for the main production numbers and every closeout should be checked against it before it is closed out and printed. If any number is outside the range it should be checked to see if it is a bad group of pigs or bad data. The minimum numbers on the checklist should be:
Average Pig Weight In
Average Pig Weight Out
Percent Death Loss
Percent DOA’s
Percent Culls and Lights
Average Daily Gain
Feed Conversion
Inventory Variance (Pigs in – Pigs Out – Death Loss – DOA’s) = 0
We have enough closeout data now to start sharing some numbers with the pork industry.
Table 1
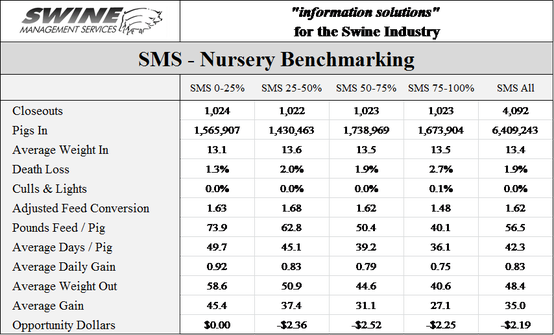
Table 1-SMS-Nursery Benchmarking show the averages for 4,092 Nursery Closeouts, 6,409,253 pigs, broke out by the Top 25%, 25-50%, 50-75% and 75-100% as ranked by the SMS Production Index. The average weight in is 13.4 pounds, with little difference between the breakdowns. But when ranked from the lightest to the heaviest it was 8.5 to 24.9 pounds. Average weight out was 48.4, with the range from 30.0 to 80.0 pounds. The 4 numbers in the SMS Production Index are:
Average Minimum Maximum
Death Loss & DOA’s 1.9% 0.0%* 15.0%*
Culls and Lights 0.0% 0.0%* 11.5%
Average Daily Gain 0.83 0.50* 1.36
Adjusted Feed Conversion 1.62 1.00* 3.00*
Table 2
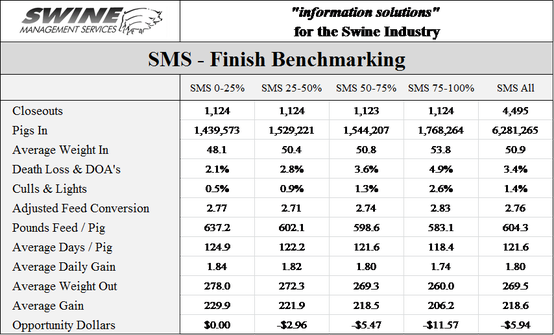
Table 2-SMS-Finisher Benchmarking show the averages for 4,495 Finisher Closeouts, 6,281,265 pigs, broke out by the Top 25%, 25-50%, 50-75% and 75-100% as ranked by the SMS Production Index. The average weight in is 50.9 pounds, with little difference between the breakdowns. But the range from the lightest to the heaviest was 25.1 to 100.0 pounds. Average weight out was 269.5, with the range from 204.0 to 319.4 pounds. The 4 numbers in the SMS Production Index are:
Average Minimum Maximum
Death Loss & DOA’s 3.4% 0.0%* 15.0%*
Culls and Lights 1.4% 0.0%* 14.5%
Average Daily Gain 1.80 1.32 2.50*
Adjusted Feed Conversion 2.76 2.02 3.79
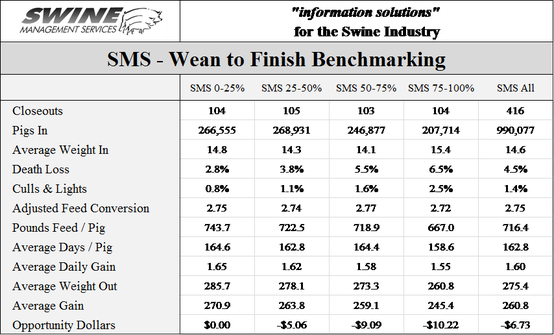 Table 3-SMS-Wean to Finish Benchmarking show the averages for 416 Wean to Finish Closeouts, 990,077 pigs, broke out by the Top 25%, 25-50%, 50-75% and 75-100% as ranked by the SMS Production Index. The average weight in is 14.6 pounds, with little difference between the breakdowns. However the range for the lightest to the heaviest is 9.6 to 25.0 pounds. Average weight out was 275.4, with the range from 220.9 to 305.6.4 pounds. The 4 numbers in the SMS Production Index are:
Average Minimum Maximum
Death Loss & DOA’s 4.5% 0.0%* 15.0%*
Culls and Lights 1.4% 0.0%* 12.7%
Average Daily Gain 1.60 1.19 1.97
Adjusted Feed Conversion 2.75 1.85 3.48
*Filter Minimum or Maximum
A key number we are able to calculate is the “Opportunity Dollars” using the SMS Modeling program we have built into the SMS Closeout Benchmarking. Every closeout is recalculated using standard market and commodity cost so we can compare closeouts over multiple years on an apple to apple basis. Each closeout is than compared to the averages of the Top 25% closeout in the SMS data base and a dollar value is assigned for each of the 4 numbers in the SMS Production Index.
Opportunity Dollars / Pig
25-50% 50-75% 75-100% ALL Total $
Nursery -$2.36 -$2.52 -$ 2.25 -$2.19 -$14,042,947
Finisher -$2.96 -$5.47 -$11.57 -$5.94 -$37,307,261
Wn to Fin -$5.06 -$9.09 -$10.22 -$6.73 -$ 6,663,454
Total -$58,013,662
As you can see from the data there are a lot of potential dollars being lost with our number showing up to $58+ million just on the closeouts in the SMS data base. Again the question we ask is “Is anyone looking at the closeouts, checking the closeouts and are you tracking performance over time to make sure you are making improvement?”
At SMS, our mission statement is to provide “Information solutions for the swine industry”. We feel with the creation of different SMS Benchmarking databases for all production areas we now have more detailed information to share with the swine industry. If your farm would like to be part of the SMS Benchmarking databases, or if you have suggestions on production areas to write articles about, please e-mail or call us. We enjoy being a part of the National Hog Farmer Weekly Preview team.
Previous Production Preview columns can be found at www.nationalhogfarmer.com.
SMS Production Index
Table 4
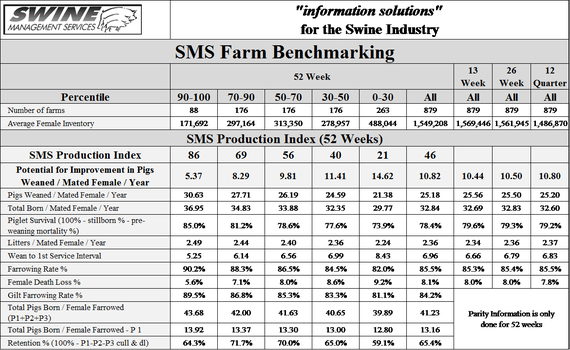
Table 4 provides the 52-week rolling averages for 11 production numbers represented in the SMS Production Index. The numbers are separated by 90-100%, the 70-90%, the 50-70%, the 30-50% and the 0-30% groups. We also included the 13-week, 26-week and 12-quarter averages. These numbers represent what we feel are the key production numbers to look at to evaluate the farm’s performance.
If you have questions or comments about these columns, or if you have a specific performance measurement that you would like us to write about, please contact: [email protected] or [email protected].
You May Also Like
Enter a zip code to see the weather conditions for a different location.